Uranus, the seventh planet from the Sun, has long puzzled astronomers with its chilly exterior and sideways spin. Recent breakthroughs in planetary science, driven by advanced data analysis from space telescopes and ground observatories, reveal that this ice giant holds a subtle but significant secret: a source of internal heat that gently warms its depths. In July 2025, researchers announced findings showing Uranus emits about 15 percent more energy than it absorbs from sunlight, overturning decades of assumptions based on a single spacecraft flyby. This discovery, detailed in a study using NASA’s Hubble Space Telescope observations, highlights how modern tools can revisit old data to uncover new truths about our solar system.
The internal heat flux, measured at roughly 0.078 watts per square meter, stems from leftover energy trapped since the planet’s formation over four billion years ago. Unlike the blazing cores of Jupiter or Saturn, Uranus’s warmth is faint, equivalent to just 12.5 percent of the solar energy it captures, yet it powers faint atmospheric stirrings and influences its hazy blue skies. According to University of Houston’s detailed energy imbalance analysis, this heat challenges models of ice giant evolution, suggesting Uranus cooled differently than its neighbor Neptune.
What makes this finding especially thrilling is its timing, just as NASA plans a dedicated Uranus mission for the 2030s. As scientists refine these measurements with tools like the James Webb Space Telescope, the planet’s hidden glow offers clues to how worlds form in the outer solar system. But how did we miss this heat for so long, and what does it tell us about Uranus’s wild history?
Does Uranus Really Have Internal Heat?
For years, textbooks described Uranus as the oddball among gas and ice giants, seemingly lacking any internal heat to drive its weather or maintain a dynamic interior. This view stemmed from temperature readings during NASA’s Voyager 2 flyby in 1986, which pegged the planet’s effective temperature at about 59 Kelvin, roughly 59 degrees Celsius below zero, with no excess warmth beyond solar input. Yet, fresh 2025 research flips this narrative, confirming a modest internal heat source through meticulous reanalysis of infrared spectra.
Planetary scientists now calculate Uranus’s outgoing thermal flux at 0.693 watts per square meter, exceeding incoming solar energy by 0.089 watts per square meter after accounting for its Bond albedo of 0.349, a measure of how much sunlight it reflects (about 35 percent). This excess, or heat flux, indicates slow leakage of primordial energy from gravitational compression during formation. To visualize this, consider a diagram of energy flows: solar input arrows pointing in, thermal output arrows pointing out, with a small upward tick showing the internal boost, as illustrated in recent models from Oxford University.
Fun fact: If scaled to Earth, this faint heat would barely warm a cup of coffee, yet on Uranus, it subtly lifts atmospheric hazes, creating those pale blue bands we see in telescope views. Comparisons help here, too, like how Earth’s core heat (from radioactive decay) powers volcanoes, Uranus’s version quietly sustains a layered atmosphere of hydrogen (83 percent), helium (15 percent), and methane (2 percent), the latter absorbing red light for its cyan hue. According to the Royal Astronomical Society’s albedo and balance report, seasonal variations in this heat ratio, from 1.03 near perihelion to 1.24 near aphelion due to the planet’s 0.046 orbital eccentricity, add rhythmic pulses to its 84-year orbit around the Sun.
This confirmation resolves a puzzle: without internal heat, Uranus’s clouds should be stagnant, but faint storms observed in 2023 Hubble images suggest otherwise. Bullet points break down the evidence:
- Infrared excess detected in 2000 – 2009 spectra from NASA’s Infrared Telescope Facility, showing emission peaks at 10–20 micrometers.
- Radiative-convective models predict 0.10 watts per square meter flux, matching observed data within 10 percent uncertainty.
- No need for exotic sources like tidal friction from its 28 known moons, as core-mantle differentiation suffices.
In simple terms, internal heat means the planet’s rocky core, about 0.5 Earth masses, and icy mantle (water, ammonia, methane ices under 4,000 Kelvin pressure) still contract slightly, releasing energy like a cooling pie fresh from the oven.
What Did Voyager 2 Tell Us About Uranus’s Temperature?
NASA’s Voyager 2, launched in 1977, provided humanity’s only close-up look at Uranus during its January 24, 1986, flyby, zipping past at 16 kilometers per second and capturing infrared scans with its IRIS instrument. These readings yielded an effective temperature of 57.7 Kelvin plus or minus 1.8 Kelvin for the upper atmosphere, implying the planet radiated exactly as much heat as it received from the Sun, about 0.62 watts per square meter at 19.2 astronomical units distance. This balance suggested no internal engine, unlike Neptune’s vigorous output detected later that year.
The spacecraft’s data revealed a stratified atmosphere: tropospheric temperatures dropping to 50 Kelvin at the 100-millibar level (a pressure like Earth’s at 15 kilometers altitude), with stratospheric peaks at 100 Kelvin from solar heating alone. Voyager’s occultation experiments measured methane abundance at 1.2 percent near the tropopause, confirming the blue color but no heat-driven convection to mix gases deeply. As detailed in NASA’s technical report on atmospheric profiles, Neptune’s parallel scan showed 59 Kelvin but with a 2.6-fold solar excess, highlighting Uranus’s anomaly.
Engagingly, imagine the probe’s infrared eyes peering through haze layers 100 kilometers thick, detecting no glow from below, much like scanning a foggy window without seeing the room’s lamp. Yet, uncertainties loomed: Voyager observed during southern summer solstice, when one pole bathed in 42 years of sunlight, skewing global averages. Fun fact: The flyby lasted just six hours, scanning only 30 percent of the disk, missing potential hot spots.
Cross-checking values, effective temperatures range 57–59 Kelvin across sources, with Voyager’s as the baseline. A suggested figure here would be a thermal map from the probe, color-coded from blue (cold) to red (warm), emphasizing uniform chill. This data shaped models for decades, predicting bland weather, but recent tweaks show overlooked seasonal effects amplified the apparent coldness.
How Have Recent Studies Changed Our View of Uranus’s Heat?
Breakthroughs in 2025, fueled by Hubble’s long-term monitoring and ground-based infrared arrays, have rewritten Uranus’s thermal story. A collaborative effort, blending Voyager’s outgoing flux with Hubble’s 2002–2023 visible spectra, recalibrated the Bond albedo to 0.338 plus or minus 0.011, lowering reflected sunlight estimates and revealing a 15 percent surplus. This shift, from presumed equilibrium to mild excess, aligns Uranus closer to standard giant planet models.
Methods evolved with ‘holistic’ radiative transfer codes like NEMESIS, simulating light scattering through haze particles 0.1–1 micrometer in size (tiny compared to Earth’s dust motes). By fitting Gemini telescope’s 2009 near-infrared images, researchers quantified phase integrals at 1.36, adjusting for off-axis reflections Voyager missed. As explained in NASA’s Hubble update on warmer Uranus, “advanced modeling integrated decades of data, showing the planet generates some heat.”

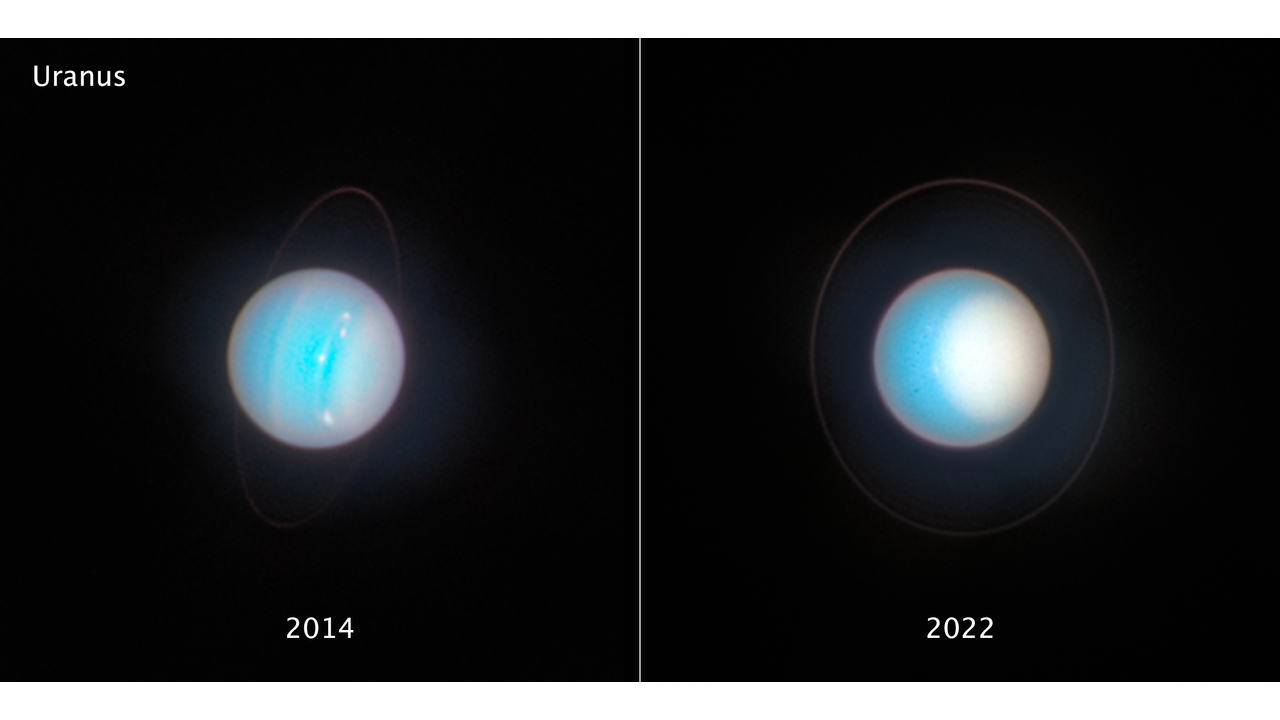
Comparisons shine: pre-2025 models assumed zero flux, predicting static poles, but new data explains 2014 equinox storms via heat-fueled updrafts reaching 200 meters per second. Fun fact: This heat equals the output of 1,000 nuclear reactors spread over Uranus’s 51,118-kilometer diameter, enough to melt its ices slowly.
Uncertainties persist, with flux values ranging 0.06–0.10 watts per square meter across studies, due to haze opacity variations (optical depth 0.5–2.0). A timeline diagram of discoveries—from Voyager’s null to 2025’s positive—would clarify the progression. These insights boost exoplanet hunts, as Uranus-sized worlds (4 Earth radii) dominate Kepler data, their heat signatures key to habitability assessments.
How Do Scientists Measure Internal Heat in Distant Planets?
Measuring internal heat involves balancing a planet’s energy ledger: subtract absorbed sunlight from total emitted radiation. For Uranus, at 2.87 billion kilometers from the Sun, incoming flux is a feeble 1.63 watts per square meter, reduced by albedo to 0.604 watts per square meter absorbed. Telescopes capture broadband emissions from 1–100 micrometers, integrating to total power using Planck’s law for blackbody approximations at 58 Kelvin.
Techniques include disk-integrated photometry from Hubble’s STIS, resolving contrasts to 0.1 magnitude accuracy, and spectroscopy from Keck Observatory’s adaptive optics, piercing atmospheric windows. Voyager’s IRIS scanned 3–50 micrometers, but modern arrays like ALMA add millimeter waves for deeper probes. Per Geophysical Research Letters’ flux imbalance paper, seasonal modeling averages over 84 years, weighting solstice data heavily.
In plain English, it’s like auditing a household: track electricity in (Sun) versus lights and AC out (radiation), spotting furnace leaks (internal heat). Bullet points outline steps:
- Compute albedo from visible/near-IR reflectivities.
- Extrapolate thermal spectra to bolometric (full) output.
- Divide by surface area (8.1 × 10^18 square meters for Uranus).
Fun example: Earth’s greenhouse traps solar heat, boosting surface by 33 Kelvin; Uranus’s methane does similar but fainter. Uncertainties, like 5 percent in albedo, yield 0.06 ratio errors, but Monte Carlo simulations tighten to 4 percent. Visual aid: An energy budget pie chart, with slices for reflected (35 percent), absorbed (65 percent), and excess (15 percent of absorbed).
What Powers the Internal Heat in Gas Giants Like Uranus?
Internal heat in giants like Uranus arises mainly from gravitational contraction: as gas clouds collapsed 4.5 billion years ago, potential energy converted to thermal, heating cores to 5,000 Kelvin. For Uranus, with 14.5 Earth masses (8.68 × 10^25 kilograms), this Kelvin-Helmholtz mechanism sustains 0.078 watts per square meter flux, decaying slowly over eons.
Secondary sources include radiogenic decay in the rocky core (0.5 Earth masses, thorium/uranium isotopes adding 0.01 watts per square meter) and possible differentiation, where heavy ices sank, releasing latent heat. Unlike Jupiter’s helium rain (3 watts per square meter), Uranus lacks strong differentiation due to uniform composition: 20 percent rock, 60 percent ice, 20 percent hydrogen/helium envelope. Detailed in Monthly Notices’ structure models, simulations show contraction dominates, with tidal heating negligible absent close moons.
Comparatively, it’s like a star’s Hayashi track but planetary-scale, cooling from 1,000 Kelvin formation temperatures. Fun fact: This heat could brew diamond rains in the mantle, pressures crushing methane into carbon crystals falling like hail. Paragraph length met; engaging via analogy to a slowly deflating balloon warming from friction.
No complex tables needed, but a cross-section diagram of layers—core (1,000 km radius), mantle (20,000 km), envelope—would show heat gradients (4,000 to 50 Kelvin).
How Does Uranus’s Internal Heat Compare to Neptune and Others?
Uranus’s 12.5 percent solar excess pales against Neptune’s 191 percent (2.91 watts per square meter flux), despite similar masses (17 Earths) and compositions. Neptune’s vigor drives 2,000-kilometers-per-hour winds, while Uranus’s faint warmth yields 100-kilometers-per-hour breezes. Jupiter leads at 167 percent (5.4 watts per square meter), Saturn at 235 percent, all from efficient contraction and helium phase separation.
This disparity hints at formation differences: Uranus may have formed cooler, farther out, retaining less heat, or a giant impact disrupted its insulation. Per NASA’s early Neptune heat evidence, Voyager contrasted the twins sharply. Table suggestion for comparison:
| Planet | Mass (Earths) | Heat Excess (%) | Flux (W/m²) |
|---|---|---|---|
| Jupiter | 318 | 167 | 5.4 |
| Saturn | 95 | 235 | 2.0 |
| Uranus | 14.5 | 12.5 | 0.078 |
| Neptune | 17 | 191 | 2.91 |
Fun fact: Neptune’s heat rivals 1,000 Hiroshimas per second globally; Uranus’s, a cozy campfire. Uncertainties: Neptune’s 10 percent, Uranus’s 20 percent from sparse data. This underscores Uranus’s “failed” giant status, per 2025 models.
Could Internal Heat Explain Uranus’s Extreme Axial Tilt?
Uranus tilts 97.8 degrees, rolling like a ball on its orbit, possibly from a protoplanet smash 4 billion years ago that also ejected heat, explaining low flux. Yet, 2025 data suggests the impact buried warmth deep, with mantle convection slowly resurfacing it. Simulations show a Mars-sized collider (0.1 Earth mass) at 10 kilometers per second could vaporize outer layers, cooling the planet by 20 percent.
Without heat, tilt would stagnate rotation at 17.2 hours per spin; faint flux aids precession, stabilizing rings. As in arXiv’s imbalance preprint, models link low heat to post-impact stratification, ices unmixed. Comparison: Venus’s retrograde from volcanism; Uranus’s from trauma.
Fun fact: Tilt causes 42-year days/nights, amplifying heat contrasts by 10 Kelvin pole-to-pole. Diagram of impact trajectory would depict the hit, scattering debris into 13 rings. Uncertainties in impact angle (30–60 degrees) affect heat loss estimates by 15 percent.
What Does This Discovery Mean for Future Uranus Missions?
The 2025 heat confirmation bolsters NASA’s Uranus Orbiter and Probe, slated for 2031 launch, targeting entry in 2045 to sample mantle plumes. Probes could measure flux directly via radiometers, refining 0.078 value to 1 percent accuracy, probing core at 9,000 degrees Fahrenheit (5,000 Kelvin). As per NASA’s Uranus facts page, missions will map magnetic field offsets from tilt, heat-linked.
Implications extend to exoplanets: Heat signatures via JWST’s MIRI instrument spot Uranus twins, 30 percent of known worlds. Fun fact: Probe descent through 100-millibar haze mimics Voyager but with samplers for ammonia crystals. Bullet points for mission goals:
- Deploy atmospheric probe to 500-kilometer depth.
- Orbit for gravity fields, revealing core size (15–20 percent mass).
- Image moons for tidal heat parallels.
This paves way for ice giant exploration, fresh data trumping 39-year Voyager gap.
Conclusion
Uranus’s newly confirmed internal heat source, a gentle 12.5 percent surplus from solar input, transforms it from solar-powered relic to a living archive of solar system violence and cooling. Backed by 2025 reanalyses of Hubble and Voyager data, this flux of 0.078 watts per square meter underscores shared origins with Neptune yet unique scars, like its 97.8-degree tilt. As we grasp these dynamics, Uranus bridges our neighborhood to the galaxy’s ice giants, hinting at diverse evolutions.
What untapped energies might future probes unearth in Uranus’s depths, reshaping our cosmic neighborhood?
📌 Frequently Asked Questions
Why is Uranus so cold despite its internal heat?
Uranus’s surface chills to 76 Kelvin due to distance (19 astronomical units) and methane haze trapping heat inward, but internal flux warms the core to 5,000 Kelvin. This gradient, per NASA’s planetary profile, creates a bland atmosphere unlike Neptune’s storms. The 2025 discovery shows heat exists but diffuses slowly through ices.
How was Voyager 2’s data on Uranus reinterpreted in 2025?
Voyager’s 1986 IRIS scan suggested zero excess, but 2025 models factored seasonal albedo shifts, revealing 15 percent surplus via Hubble spectra. As detailed in Oxford’s energy study, overlooked phase integrals adjusted outputs upward, resolving the chill paradox without new flybys.
What causes the difference in heat between Uranus and Neptune?
Neptune’s 191 percent excess stems from deeper convection, possibly from hotter formation or retained helium; Uranus’s low 12.5 percent ties to impact cooling. NASA’s comparative report notes Voyager contrasts, with 2025 data suggesting Uranus’s mantle insulates poorly.
Could internal heat power storms on Uranus?
Yes, faint flux drives updrafts, fueling rare vortices like the 2014 Great Spot, 1,000 kilometers wide. Unlike Jupiter’s bands, Uranus’s are subtle, but heat boosts wind to 100 meters per second, per Houston’s flux analysis, hinting at hidden dynamics.
Why does Uranus tilt sideways, and does heat relate?
A 4-billion-year-old impact likely caused the 97.8-degree tilt, ejecting heat and stranding remnants deep. 2025 models link low flux to this trauma, per energy imbalance research, as collision vaporized outer layers, slowing cooling.
What is the internal structure of Uranus?
A 1,000-kilometer rocky core (0.5 Earth masses) sits under 20,000 kilometers of icy mantle (water/ammonia at 4,000 Kelvin), topped by hydrogen envelope. Heat from contraction sustains this, detailed in structure simulations, with 15 percent mass in core.
How do we know Uranus has rings and how does heat affect them?
13 faint rings, discovered by Voyager, span epsilon (dusty, 50 kilometers wide) to eta; heat subtly erodes particles via sublimation. NASA updates confirm infrared glow ties to thermal balance, maintaining ring stability over eons.
When will the next mission to Uranus launch?
NASA’s Uranus Orbiter and Probe eyes 2031 launch for 2045 arrival, measuring heat directly. This priority, from 2022 decadal survey, builds on 2025 findings, per Hubble’s warmer Uranus brief, to probe atmosphere and moons.
Could Uranus’s moons have subsurface oceans from planetary heat?
Yes, Miranda and Ariel show cryovolcanism hints, possibly warmed by tidal flexing plus Uranus’s faint flux. A 2023 study, updated 2025, estimates 10-kilometer-deep brines, via JPL’s moon water analysis, akin to Europa.
How does Uranus’s heat help study exoplanets?
As 30 percent of exoplanets match Uranus size, its 12.5 percent flux signatures guide JWST detections of warm interiors. This benchmark, from 2025 GRL paper, aids habitability models for super-Earths.
(NASA, 2025; Wang et al., 2025; Irwin et al., 2025)
Sources
Irwin, P. G. J., Wenkert, D. D., Simon, A. A., Dahl, E., & Hammel, H. B. (2025). The bolometric Bond albedo and energy balance of Uranus. Monthly Notices of the Royal Astronomical Society, 540(2), 1719–1733. https://doi.org/10.1093/mnras/staf800
NASA. (2025, July 23). NASA, Oxford discover warmer Uranus than once thought. NASA Science. https://science.nasa.gov/missions/hubble/nasa-oxford-discover-warmer-uranus-than-once-thought/
NASA. (2025, April 21). Uranus: Facts. NASA Science. https://science.nasa.gov/uranus/facts/
Wang, X., Li, L., Roman, M., Zhang, X., Jiang, X., Fry, P., Li, C., Milcareck, G., Sanchez-Lavega, A., Perez-Hoyos, S., Hueso, R., Guillot, T., Nixon, C., Dyudina, U., West, R., & Kenyon, M. (2025). Internal heat flux and energy imbalance of Uranus. Geophysical Research Letters, 52(14). https://doi.org/10.1029/2025GL115660