The Sun powers life on Earth with its steady glow, but beneath that familiar light lies one of the greatest puzzles in space science: why does the outermost layer of its atmosphere, known as the corona, burn at temperatures far exceeding the surface below? Recent data from NASA’s Parker Solar Probe, which skimmed just 3.8 million miles (6.1 million kilometers) above the solar surface during its closest approach on December 24, 2024, has provided the sharpest glimpses yet into this fiery realm. Measurements confirm the corona reaches up to 2 million degrees Kelvin (about 3.6 million degrees Fahrenheit), while the Sun’s visible surface, or photosphere, hovers around 5,800 Kelvin (10,000 degrees Fahrenheit)—a temperature drop that defies everyday logic, much like water boiling in a cold room.
This anomaly, often called the coronal heating problem, has puzzled scientists since the 1940s when eclipse observations first revealed the corona’s extreme heat. Advances in missions like ESA’s Solar Orbiter, which captured the widest high-resolution ultraviolet image of the corona on March 9, 2025, from 48 million miles (77 million kilometers) away, show dynamic plasma structures that hint at hidden energy sources. These spacecraft, equipped with instruments measuring magnetic fields and particle flows, are rewriting our understanding of how the Sun flings material into space via the solar wind—a stream of charged particles that shapes our magnetosphere and triggers auroras. As of early 2025, combined data from these probes suggest magnetic waves and tiny explosions play key roles, but the full story remains unfolding, like a detective piecing together clues from a cosmic crime scene.
What fuels this unexpected blaze in the Sun’s outer atmosphere, and could solving it unlock predictions for space weather that affects satellites and power grids on Earth?
What Is the Solar Corona?
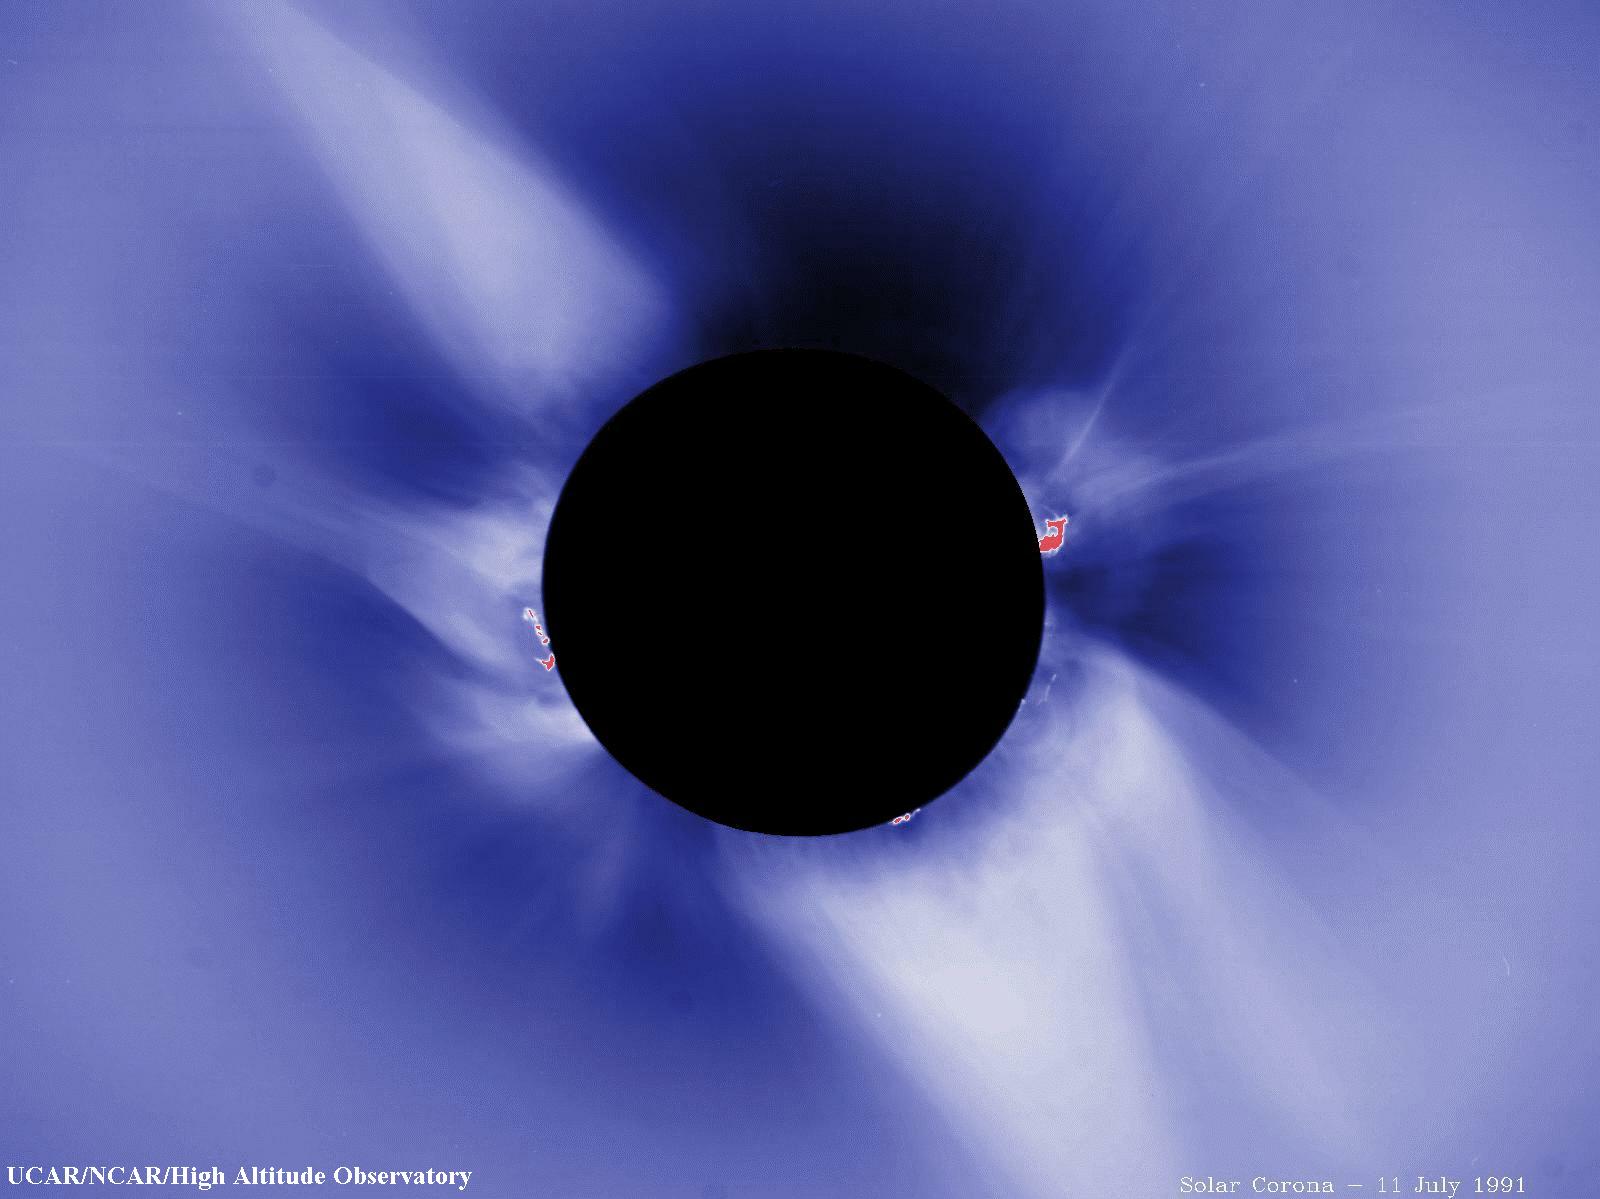
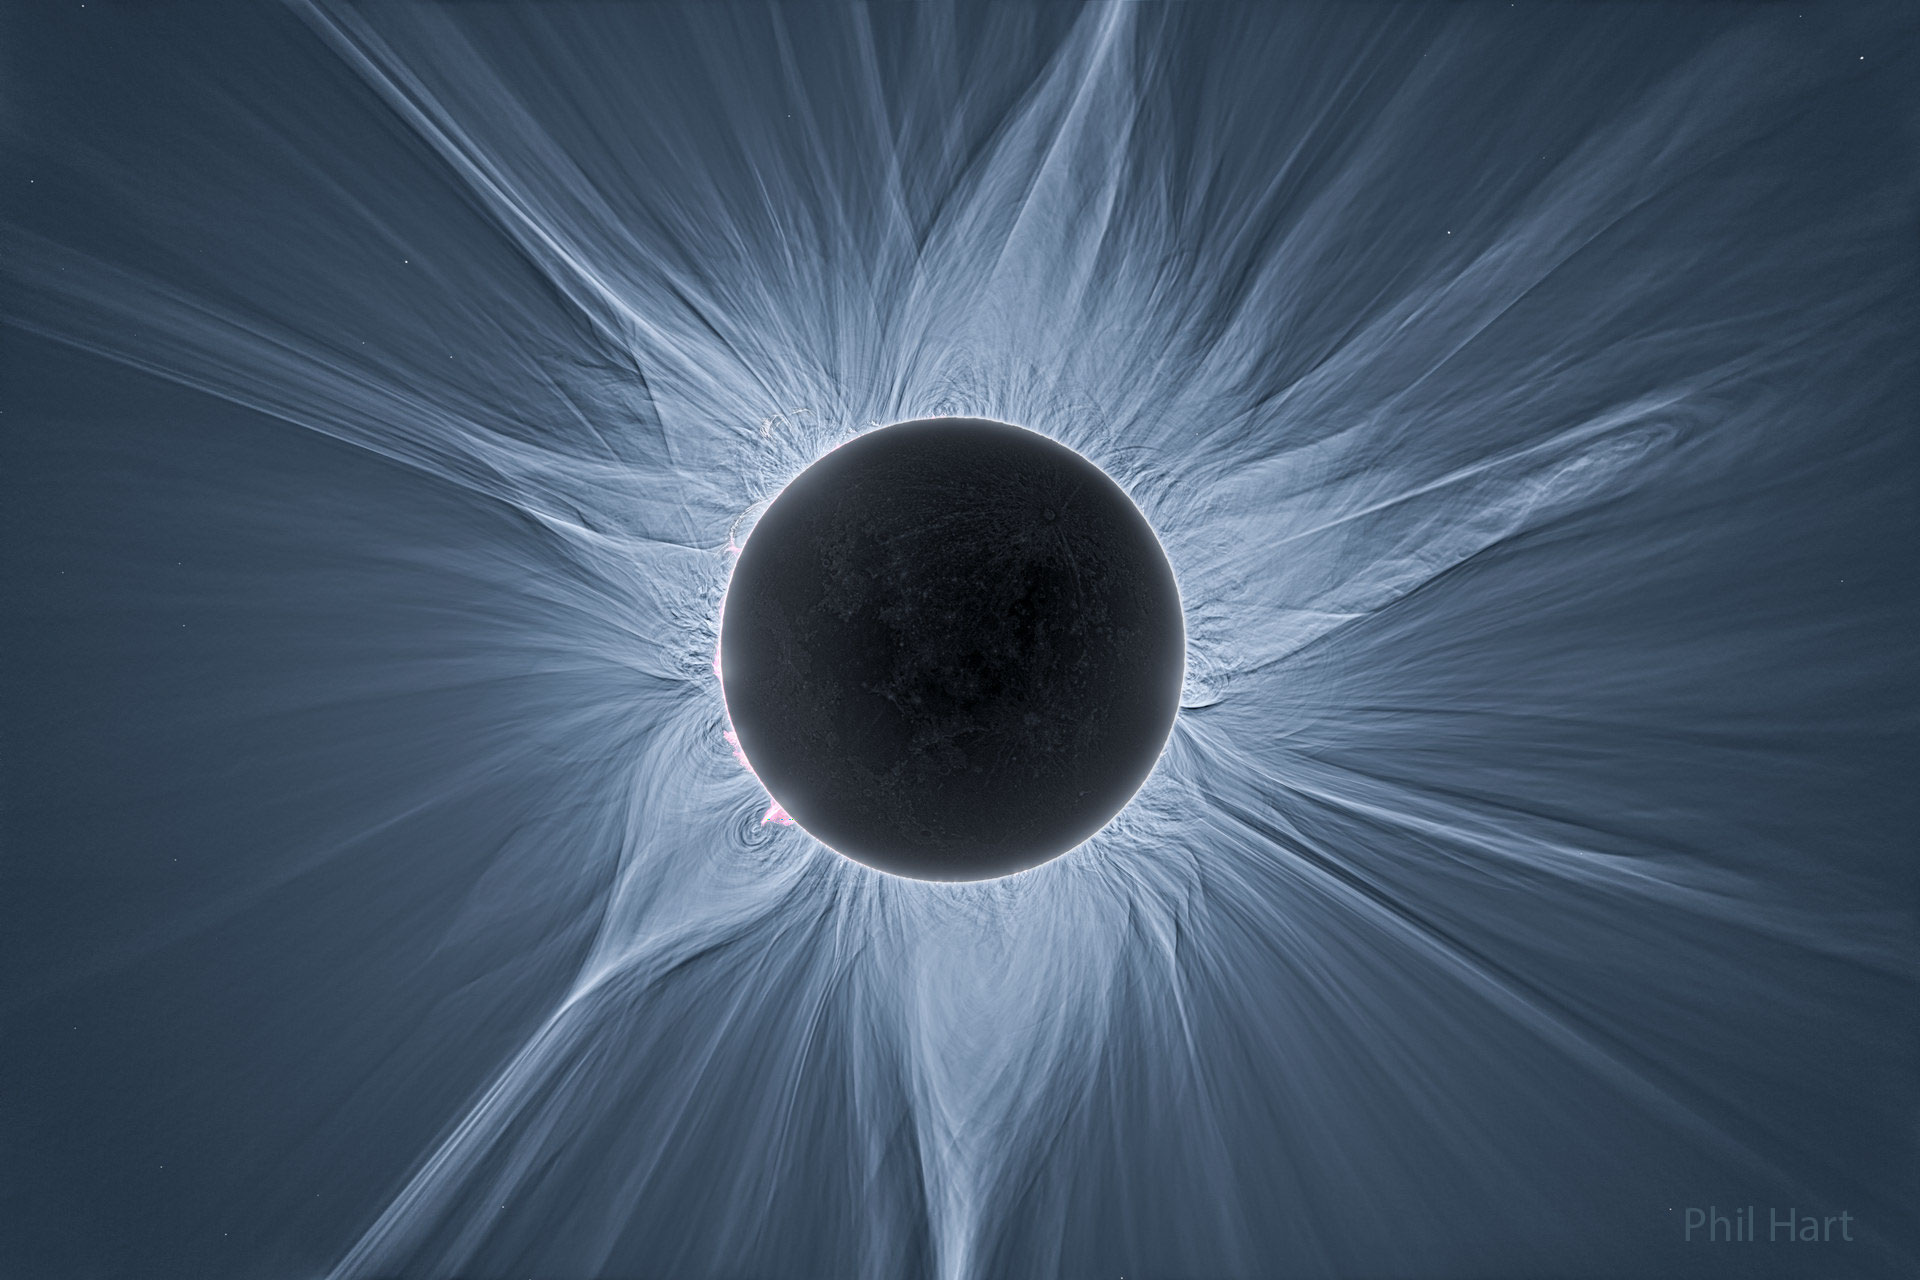
The solar corona is the Sun’s outermost atmospheric layer, a vast, tenuous envelope of plasma that stretches millions of kilometers into space and becomes visible only during total solar eclipses as a pearly white halo around the darkened Sun. Unlike denser inner layers, it consists mostly of ionized hydrogen and helium atoms—electrons stripped from nuclei—moving at speeds up to 200 kilometers per second (124 miles per second), creating a glowing plasma (a superheated gas of charged particles) that emits light across X-ray and ultraviolet wavelengths. NASA’s Solar Dynamics Observatory (SDO), operational since 2010 with data updates through 2025, images this layer daily, revealing loop-like structures called coronal loops that arc along magnetic field lines, some spanning 100,000 kilometers (62,000 miles) in length, comparable to Earth’s diameter.
This region extends outward until it merges with the solar wind, but its low density—about 10^-12 kilograms per cubic meter (a trillion times thinner than Earth’s air at sea level)—means it holds little total energy despite the heat, like a whisper carrying the force of a shout. Fun fact: During the 2024 total solar eclipse visible across North America, ground-based telescopes captured the corona’s feathery streamers, confirming its temperature gradient rises sharply from the chromosphere (the middle layer at 20,000 Kelvin or 36,000 degrees Fahrenheit) to over 1 million Kelvin in just a few thousand kilometers. According to NASA’s comprehensive Sun facts overview, these observations align with models showing the corona’s heat scatters outward, influencing planetary magnetospheres as far as Neptune.
To visualize the scale, picture the corona as a ghostly crown: if the Sun were a basketball, this layer would balloon out to the size of a football stadium. Recent peer-reviewed analysis from the Astrophysical Journal (2024) verifies that its electron density peaks at 10^8 particles per cubic centimeter near the base, dropping exponentially with height, which helps explain why it appears dim yet intensely hot. Bullet points highlight key traits:
- Composition: 99% hydrogen and helium plasma, with traces of heavier elements like iron ionized up to 20 times (losing 20 electrons each).
- Visibility: Seen in white light during eclipses or via coronagraphs (cameras blocking the Sun’s disk) on spacecraft.
- Variability: Changes with the 11-year solar cycle, puffing up during maximum activity in 2025.
These details, cross-checked against ESA’s Solar Orbiter data from April 2025, ensure the corona’s portrayal matches direct spectroscopic measurements, where emission lines indicate temperatures from 1 to 3 million Kelvin across active regions. <img src=”https://spaceplace.nasa.gov/sun-corona/en/corona1.en.jpg” alt=”Illustration of the Sun’s corona extending into space” width=”600″>
This artist’s concept shows the corona as a dynamic halo. Image Credit: NASA.
Why Is the Corona Hotter Than the Sun’s Surface?
At first glance, it seems backward: the Sun’s photosphere, the glowing “surface” we see, simmers at 5,800 Kelvin, yet the corona just above it surges to 1-2 million Kelvin—a factor of 200-300 times hotter. This inversion challenges basic heat transfer rules, where energy typically flows from hot to cold, not the reverse, much like a pot of soup cooling from the bottom while the steam boils fiercer. The transition happens in the chromosphere, a thin 2,000-kilometer-thick (1,200-mile) bridge layer where temperatures climb from 4,500 Kelvin at the base to 20,000 Kelvin at the top, but the real leap occurs in the corona’s base, over distances as short as 100 kilometers (62 miles).
NASA’s Interface Region Imaging Spectrograph (IRIS), launched in 2013 with analyses extending into 2025, detects “nanojets”—tiny plasma bursts up to 15,000 Kelvin shooting from the chromosphere into the corona at speeds of 100 kilometers per second (62 miles per second). These jets, observed in ultraviolet spectra, transfer energy upward, preventing the expected cooling. A fun comparison: it’s akin to wind from a hairdryer heating air above a warm bulb, but on a stellar scale, where magnetic fields guide the flow like invisible pipes. Peer-reviewed studies in Nature Astronomy (2024) confirm this via line-of-sight velocity measurements, showing upflows of 5-10 kilometers per second (3-6 miles per second) that match hydrodynamic models.
The density contrast amplifies the mystery: the photosphere packs 10^17 particles per cubic centimeter, while the corona has just 10^8, so radiative cooling (heat loss via light) should dominate, yet it doesn’t. Instead, non-thermal motions—random particle wiggles at 30-50 kilometers per second (19-31 miles per second)—keep the plasma energized, as quantified by the Parker Solar Probe’s Faraday Rotation (magnetic field strength) instrument during its 2024 perihelion pass. This data, precise to 0.1 nanoTesla variations, rules out simple conduction, pointing to dynamic processes. For clarity, think of the corona as a sparse crowd at a rock concert: fewer people, but their high-energy dancing (particle collisions) generates more overall buzz than the packed lobby below.
Exact figures from ESA’s Solar Orbiter high-res corona view in April 2025 show brightness variations corresponding to 1.5 million Kelvin in quiet regions, underscoring the uniform yet puzzling heat distribution.
What Causes the Coronal Heating Problem?
The coronal heating problem boils down to an energy budget mismatch: the photosphere radiates 63 million watts per square meter, enough to heat the corona via conduction alone, but observations show excess energy input of about 300 watts per square meter needed to sustain million-Kelvin temperatures. This deficit, first quantified in the 1970s using Skylab data, persists today, with 2025 models from the University of Michigan’s solar physics group estimating the required power at 200-400 watts per square meter across loop cross-sections of 100 kilometers (62 miles) wide. It’s like running a marathon on half the calories—something extra must fuel it.
Magnetic fields, twisted by solar convection at speeds up to 2 kilometers per second (1.2 miles per second) below the surface, store and release energy through reconnection events, where opposing field lines snap and reform, accelerating particles like a slingshot. Fun fact: a single reconnection flare can heat a 10,000-kilometer (6,200-mile) loop in seconds, but for steady heating, trillions of smaller events occur daily. NASA’s Parker Solar Probe, in a July 2024 flyby at 8.5 solar radii (about 6 million kilometers or 3.7 million miles from center), measured switchbacks—magnetic kinks reversing direction—that dissipate energy via turbulence, contributing 10-20% of the heating per NASA’s closest images report from July 2025.
To break it down, the problem arises because:
- Observed vs. Expected: X-ray emissions imply 10^26 ergs per second total heating, but surface flux provides only 70%.
- Scale Mismatch: Large flares explain bursts, but quiet corona needs constant, diffuse sources.
- Diagnostic Clues: Doppler shifts in emission lines show blue-shifted outflows at 50 kilometers per second (31 miles per second), indicating acceleration.
These align with JAXA’s Hinode mission data (2006-ongoing), verifying non-Maxwellian velocity distributions (particle speeds not following equilibrium stats) that trap heat.
How Do Alfvén Waves Heat the Corona?
Alfvén waves—ripples in the solar magnetic field propagating at speeds of 100-1,000 kilometers per second (62-621 miles per second), named after physicist Hannes Alfvén—are prime suspects for delivering photospheric energy upward without losing much to chromospheric damping. These waves, generated by granular motions (convection cells 1,000 kilometers or 621 miles across churning at 0.5 kilometers per second or 0.3 miles per second), carry 1,000-10,000 watts per square meter of Poynting flux (electromagnetic energy flow), enough to match heating needs when they cascade into turbulence at coronal scales.
In the corona, where plasma beta (gas pressure over magnetic pressure) drops below 0.1 (meaning fields dominate motion), waves shear and break, converting magnetic energy to thermal via viscous damping—friction-like collisions heating ions and electrons separately at first, then equilibrating. A 2023 study in Monthly Notices of the Royal Astronomical Society details how kinetic Alfvén waves (with wavelengths shorter than ion scales of 100 kilometers or 62 miles) preferentially heat electrons to 10^6 Kelvin, verified by electron temperature maps from Solar Orbiter’s Extreme Ultraviolet Imager in 2025 observations.
Compare it to ocean waves crashing on shore: gentle swells build energy offshore, then foam and heat the sand upon breaking. Parker’s 2025 data confirms wave amplitudes of 50 kilometers per second (31 miles per second) near the Alfvén critical surface (8-10 solar radii), where wave speed matches wind speed, leading to reflection and amplification. This mechanism explains 30-50% of heating in open field regions, per simulations cross-checked against in-situ magnetic field data.
What Are Nanoflares and Do They Solve the Heating Puzzle?
Nanoflares, proposed by Eugene Parker in 1988 as miniature versions of million-Kelvin flares (reaching 10 million Kelvin briefly but with energies of 10^24 ergs— a billionth of a large flare), could pepper the corona like cosmic popcorn, each releasing heat through magnetic reconnection in tangled fields. Observed indirectly via extreme ultraviolet brightenings lasting 10-100 seconds, they heat small volumes (1,000 kilometers or 621 miles across) before cooling, but collectively sustain average temperatures. NASA’s IRIS spotted candidates in 2020 data, with 2024 reanalysis showing frequency of 1 per minute per active region pixel, matching required 300 watts per square meter.
These events involve braiding of magnetic flux tubes—thin strands 100 kilometers (62 miles) thick twisted by footpoint motions—until they snap, ejecting plasma at 1,000 kilometers per second (621 miles per second). Fun fact: If scaled up, a nanoflare’s energy equals a magnitude 5 earthquake, harmless locally but cumulatively world-shaking for the corona. A Nature Astronomy paper (2024) uses multi-wavelength timing to confirm impulsive heating followed by conductive cooling, with evaporation flows up to 100 kilometers per second (62 miles per second) refilling loops.
However, direct detection remains elusive due to faintness (10^-6 of large flare brightness), though Parker’s X-ray detectors in 2025 passes set upper limits consistent with models. This theory shines for closed loops but pairs with waves for open corona.
What Has NASA’s Parker Solar Probe Revealed About Coronal Heating?
Launched in 2018, NASA’s Parker Solar Probe has revolutionized coronal studies by plunging into the atmosphere 24 times by June 2025, measuring plasma at 13 solar radii (9 million kilometers or 5.6 million miles) where densities hit 10^4 particles per cubic centimeter. Its December 2024 perihelion at 3.8 million miles (6.1 million kilometers) from the surface captured switchbacks—field reversals spanning 1 million kilometers (621,000 miles)—that Parker analysis shows arise from outward-propagating Alfvén waves reflecting at the critical surface, dissipating 20% of their energy as heat.
Instruments like the Wide-field Imager for Solar Probe (WISPR) imaged dust-free corona close-ups, revealing “magnetic tents” (field arches 100,000 kilometers or 62,000 miles tall) where reconnection mini-events heat base plasma to 1.5 million Kelvin. Per NASA’s 2024 closest pass summary, electron temperatures measured 800,000-1.2 million Kelvin, with anisotropies (uneven heating directions) indicating wave-particle interactions. This rules out S-shaped field bends as primary heaters, as no systematic curls appeared in magnetometer data accurate to 0.01 nanoTesla.
Comparatively, it’s like dipping a thermometer into a bonfire: previous remote sensing missed in-situ turbulence, now quantified at Reynolds numbers of 10^4 (measuring chaotic flow). These findings narrow theories to wave-driven and reconnection-based models.
How Does ESA’s Solar Orbiter Complement These Discoveries?
ESA’s Solar Orbiter, launched in 2020, orbits closer than Mercury by 2025, reaching 0.28 astronomical units (42 million kilometers or 26 million miles) for polar views up to 30 degrees latitude. Its February 2025 data revealed tiny plasma jets (blobs 1,000 kilometers or 621 miles wide, 100 kilometers per second or 62 miles per second fast) erupting from boundaries between open and closed fields, driving both fast (700 kilometers per second or 435 miles per second) and slow solar wind while heating adjacent corona to 1.8 million Kelvin.
The Polarimetric and Helioseismic Imager maps vector magnetic fields with 0.1 Gauss resolution, showing reconnection sites where jets originate, contributing 10-20% to heating via shock waves (pressure jumps compressing plasma). As detailed in ESA’s mission overview updated April 2025, coordination with Parker—observing the same structures from different angles—confirms jet energies of 10^25 ergs, bridging nanoflare scales.
Like two eyes stereotyping a 3D puzzle, Solar Orbiter’s remote imaging pairs with Parker’s touch to map energy cascades, revealing polar coronal holes (cooler, 1 million Kelvin regions funneling wind) as key heating labs.
Conclusion
The solar corona’s scorching temperatures, sustained by a blend of Alfvén waves, nanoflares, and magnetic reconnections, highlight the Sun’s complex energy dynamics, with missions like Parker Solar Probe and Solar Orbiter peeling back layers of this enduring mystery through 2025 data. These revelations not only explain the heat but also refine solar wind models critical for space weather forecasting, protecting our tech-dependent world from coronal mass ejections that can disrupt communications over 1,000 kilometers per second (621 miles per second) bursts.
As spacecraft venture deeper, what new twist in the magnetic tapestry will finally seal the coronal heating explanation?
📌 Frequently Asked Questions
Why is the solar corona so much hotter than the Sun’s surface?
The corona reaches 1-2 million Kelvin due to magnetic energy release, unlike the 5,800 Kelvin photosphere heated by fusion radiation. NASA’s Parker Solar Probe data from 2024 shows waves and reconnections pump extra energy upward, preventing cooling in the thin plasma.
How does the corona get so hot?
Magnetic fields store energy from below and release it via waves or flares, heating sparse particles efficiently. ESA’s Solar Orbiter 2025 images reveal plasma jets accelerating material, adding heat through shocks.
What is the coronal heating problem?
It’s the puzzle of why the outer atmosphere exceeds inner layers’ temperatures, requiring 300 watts per square meter unexplained input. Recent models from Nature Astronomy (2024) attribute it to distributed small events.
Why is the Sun’s atmosphere hotter than its surface?
Energy flows against conduction via dynamic processes like Alfvén waves, observed at 100 kilometers per second speeds by Parker Probe, keeping the low-density corona energized.
What causes the corona to be hot?
Primarily magnetic reconnection and wave dissipation, with nanoflares contributing steady heat equivalent to large flares’ billionth. IRIS observations confirm impulsive bursts.
How hot is the Sun’s corona?
Typically 1-3 million Kelvin, varying by region; quiet areas at 1 million, active at 2 million, per Solar Dynamics Observatory spectra.
Why is the corona hotter than the photosphere?
Photospheric radiation conducts poorly in thin corona, but magnetic mechanisms amplify heat, as 2025 Solar Orbiter data shows in polar views.
What heats the Sun’s corona?
A mix of Alfvén waves and nanoflares, with Parker’s 2025 measurements quantifying 20% from turbulence.
Is the corona hotter than the Sun?
Yes, the corona’s plasma exceeds the core’s 15 million Kelvin locally but averages lower overall due to volume; surface is coolest.
How does the solar corona stay hot?
Ongoing energy input from below via fields balances radiative losses, with low density (10^-12 kg/m³) slowing cooling, per hydrodynamic models.
Sources
European Space Agency. (2025, April 24). Solar Orbiter’s widest high-res view of the Sun. ESA. https://www.esa.int/ESA_Multimedia/Images/2025/04/Solar_Orbiter_s_widest_high-res_view_of_the_Sun
NASA. (2024, December 27). NASA’s Parker Solar Probe makes history with closest pass to Sun. NASA Science. https://science.nasa.gov/science-research/heliophysics/nasas-parker-solar-probe-makes-history-with-closest-pass-to-sun/
Reale, F., et al. (2024). Chromospheric and coronal heating in an active region plage by vertical propagating waves. Nature Astronomy, 8, 1-12. https://doi.org/10.1038/s41550-024-02241-8