In the spring of 2024, a powerful barrage of solar activity unleashed coronal mass ejections, or CMEs, racing toward Earth at speeds exceeding 1,900 kilometers per second. These events, part of Solar Cycle 25’s rising phase, triggered a G5-level geomagnetic storm—the strongest in over two decades—that painted auroras across unusually low latitudes, from Alabama to the Amazon. According to NASA’s tracking of the May 2024 solar storm, the influx of charged particles disrupted over 100 satellites and briefly affected high-frequency radio communications worldwide, highlighting our growing reliance on vulnerable technology (NASA, 2024). As the Sun’s activity peaks in late 2025, with forecasted sunspot numbers averaging 115 per month, experts warn of increased risks to power grids and navigation systems.
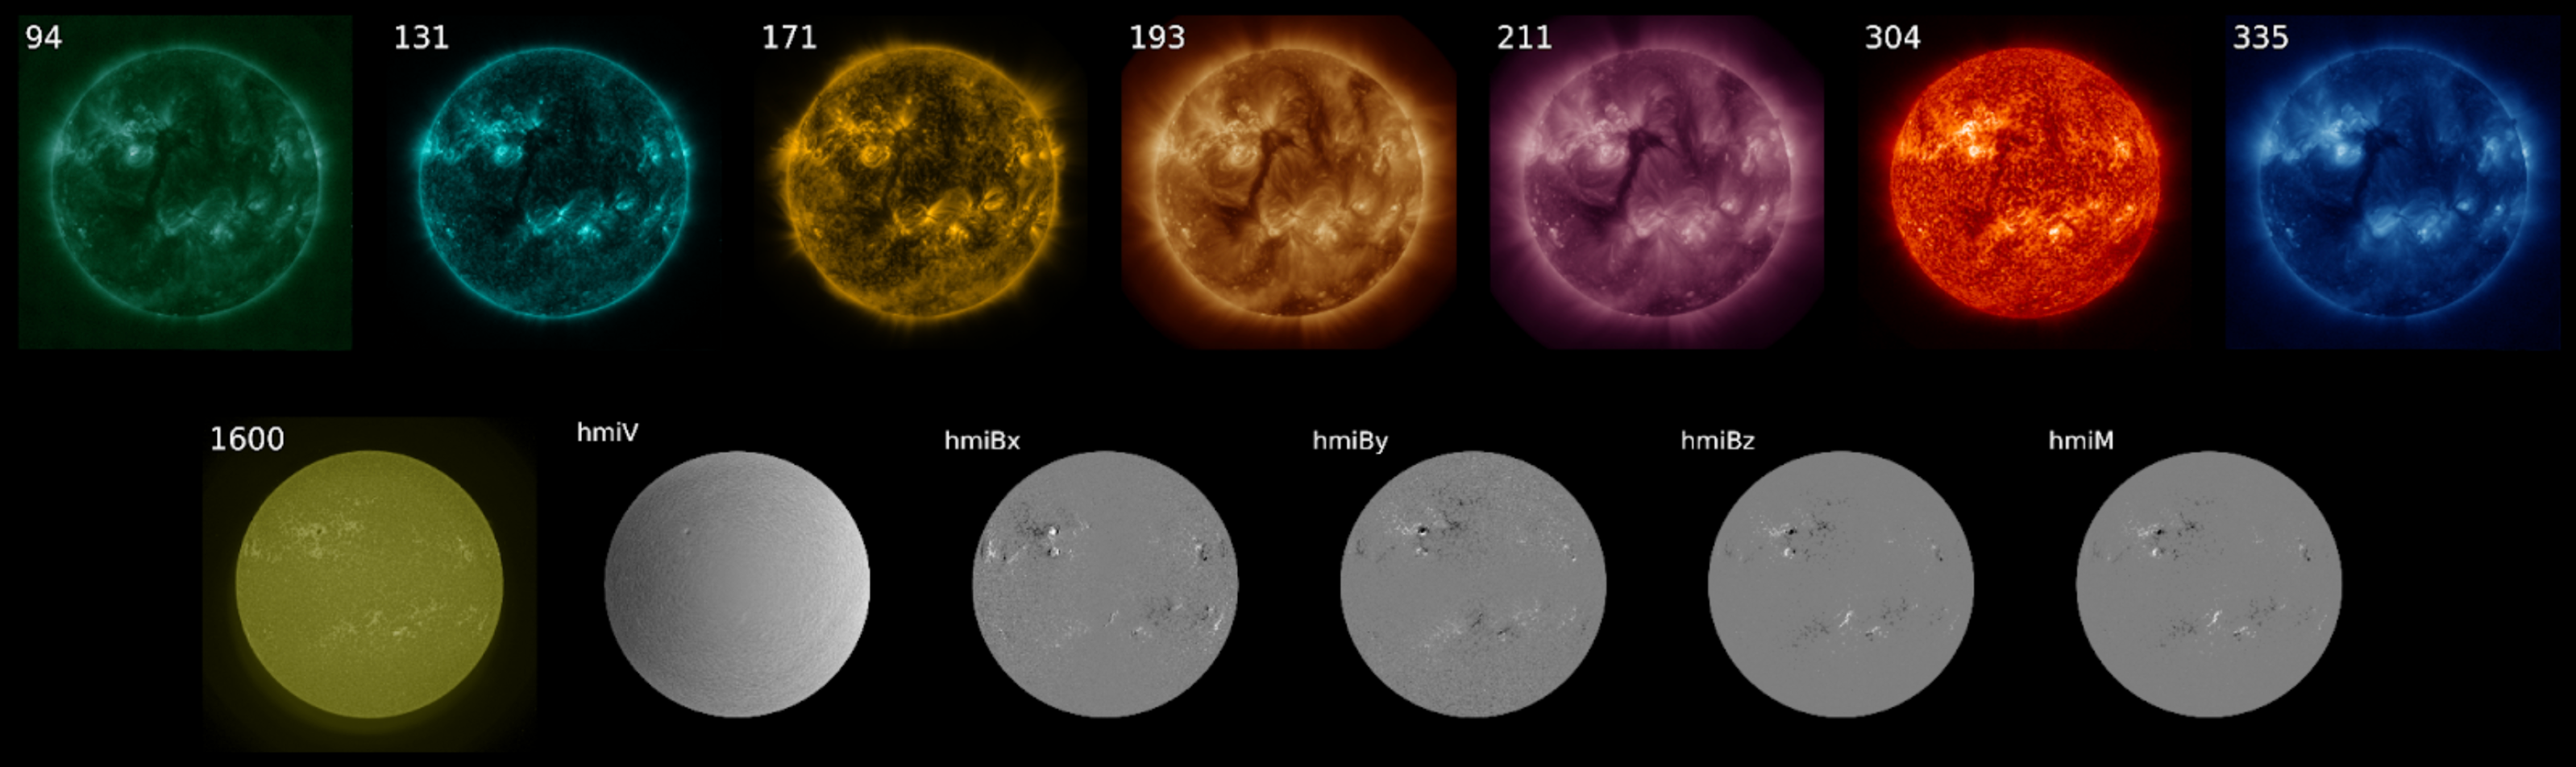
Fast forward to August 2025, when NASA and IBM unveiled Surya, a cutting-edge AI foundation model trained on nine years of solar imagery from the Solar Dynamics Observatory. This tool not only analyzes ultraviolet images of the Sun’s corona but also forecasts solar flares up to two hours ahead, outperforming traditional methods by 16 percent in accuracy. Drawing from data spanning a full solar cycle, Surya integrates magnetic field maps and velocity observations to spot patterns invisible to the human eye, as detailed in NASA’s announcement of the Surya heliophysics model (NASA, 2025a). Such advancements come at a critical time, as space weather events could cost economies billions in damages if unprepared.
These developments signal a shift from reactive defenses to proactive safeguards, blending vast datasets with machine learning algorithms. Yet, with the Sun’s behavior remaining notoriously unpredictable, the question lingers: Can AI truly outsmart the next solar surprise before it strikes?
What Are Solar Storms Exactly?
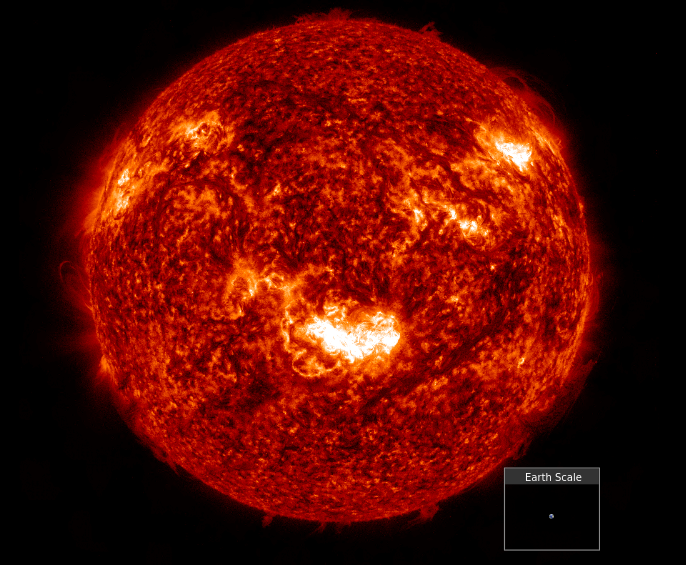
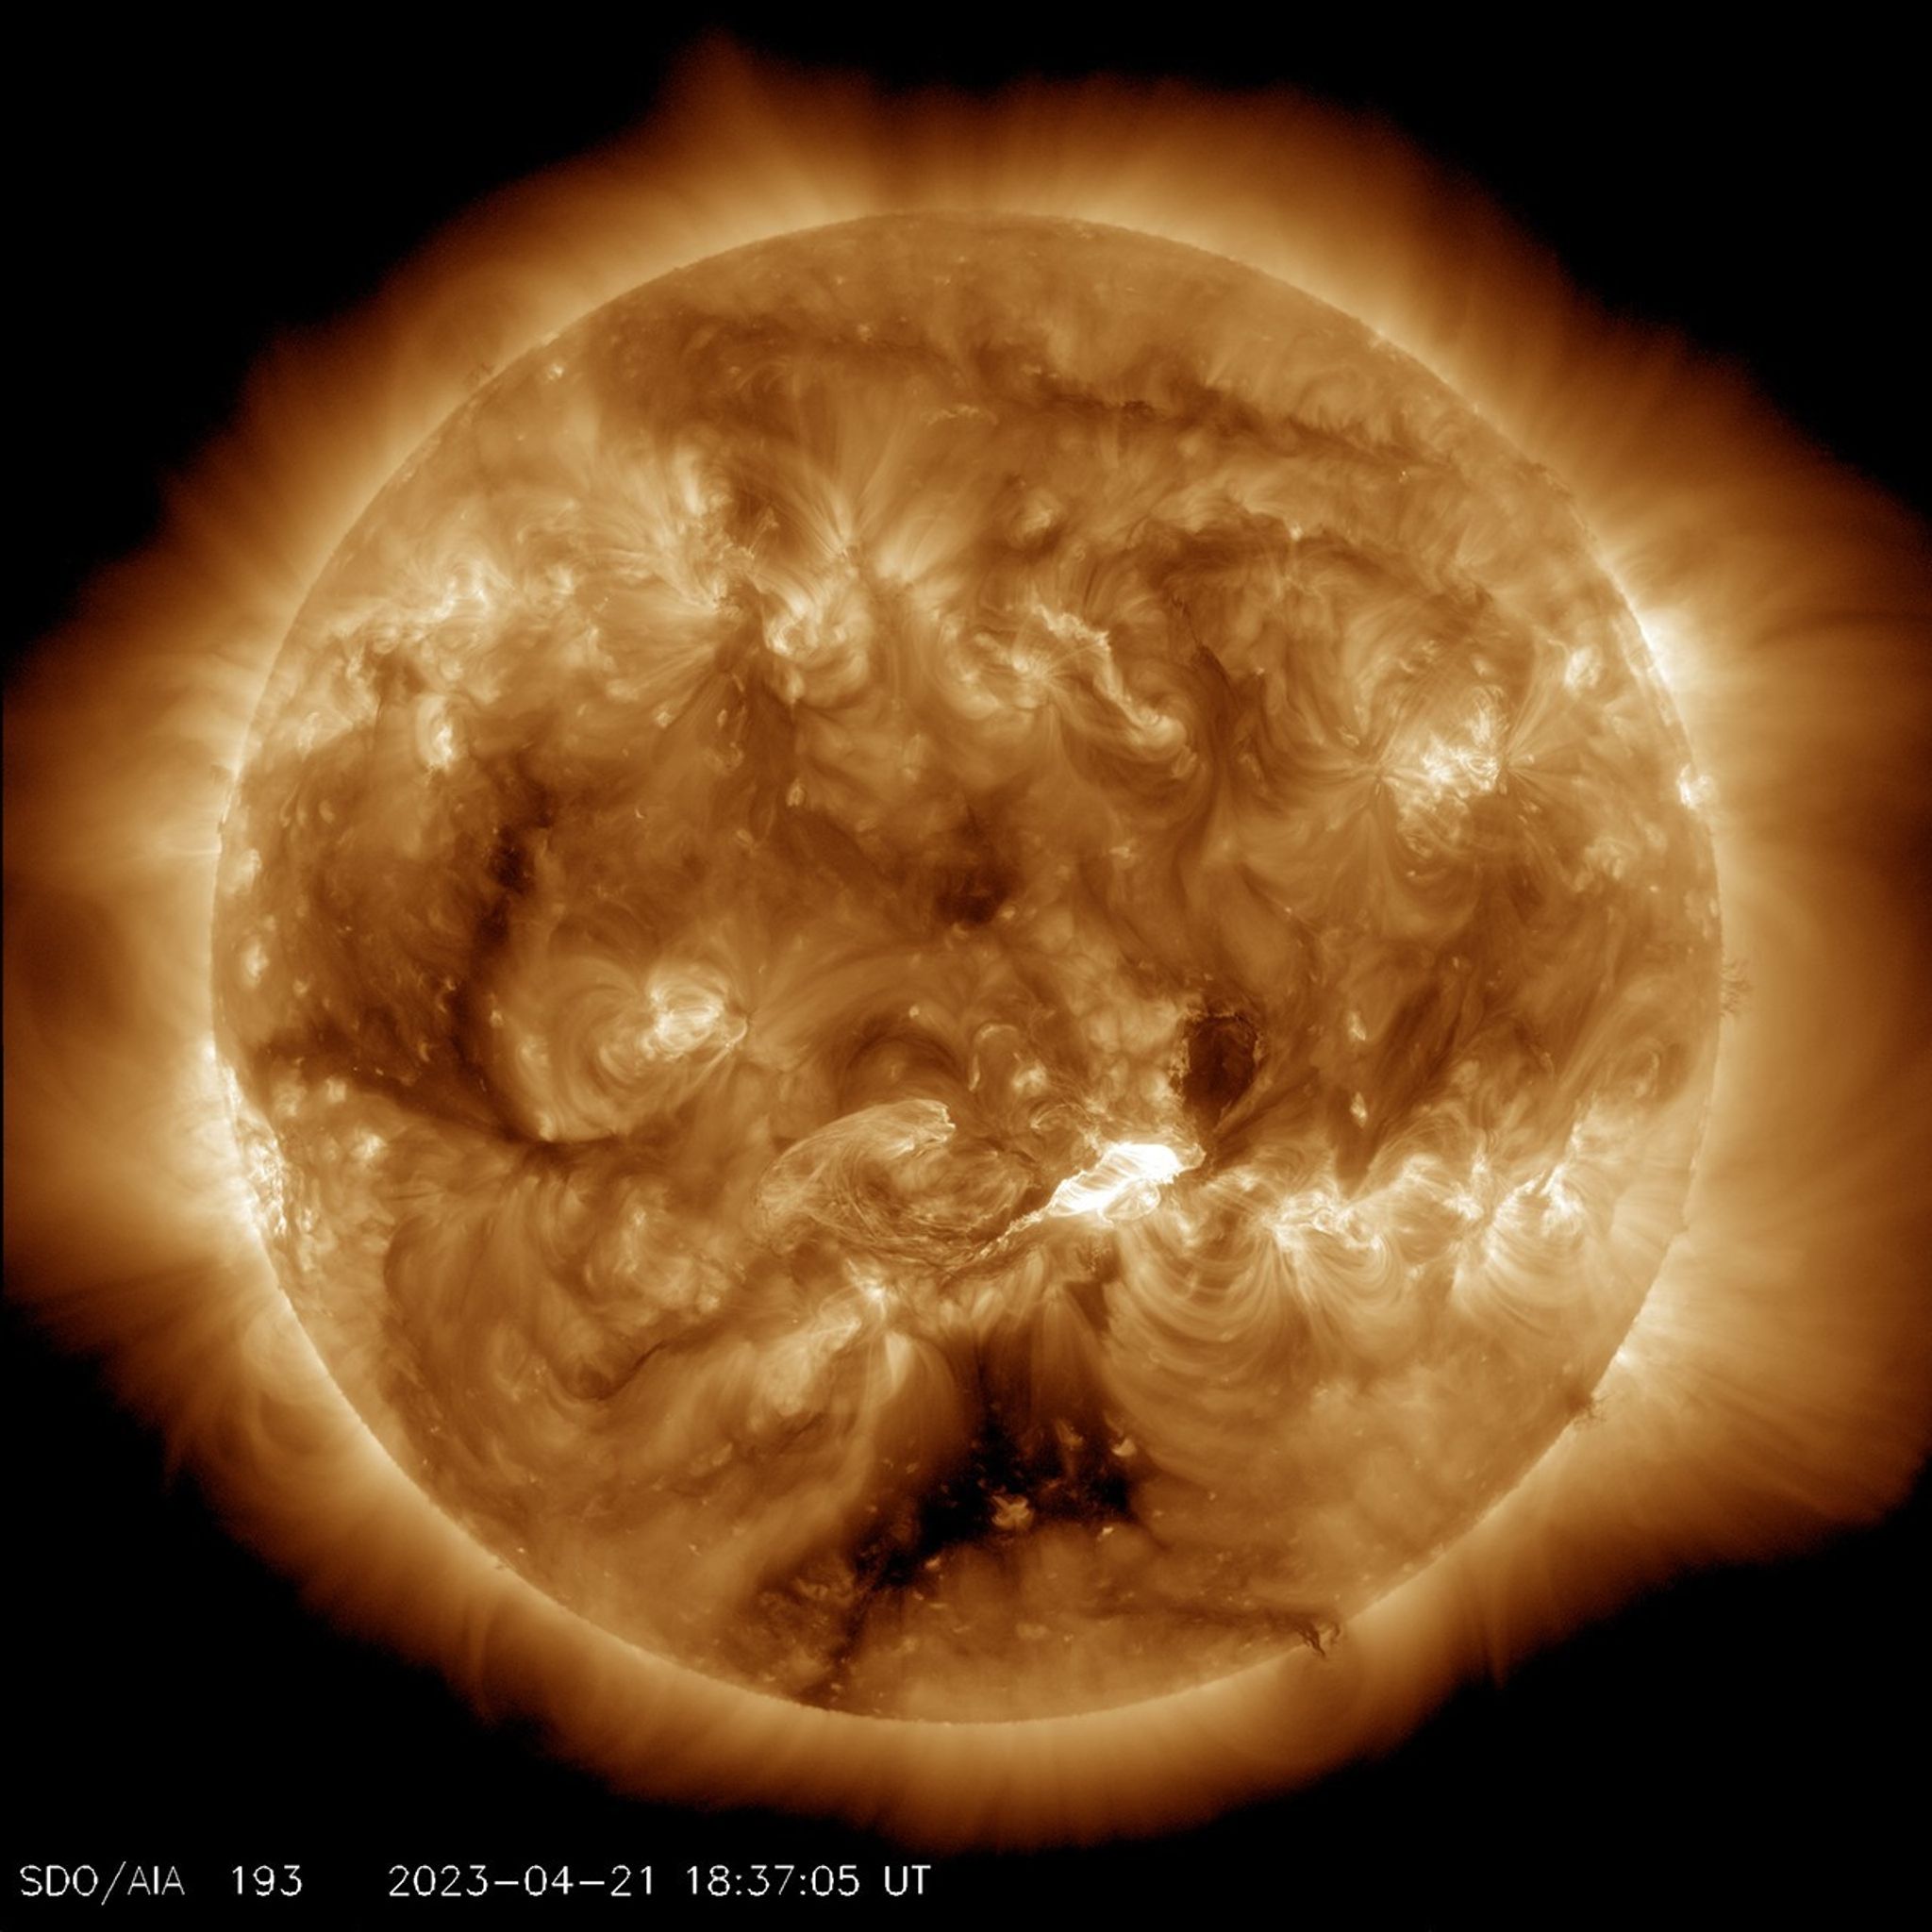
Solar storms refer to bursts of energy and particles from the Sun that ripple through space, often stemming from sunspots—dark, cooler regions on the solar surface where magnetic fields twist and tangle. These spots, which can span up to 50,000 kilometers across, build tension until they release in forms like solar flares or CMEs. A solar flare is a sudden flash of radiation across the electromagnetic spectrum, lasting minutes to hours and releasing energy equivalent to millions of hydrogen bombs, while a CME ejects billions of tons of plasma at velocities from 250 to 3,000 kilometers per second. For context, that’s faster than a bullet train circling Earth multiple times in a day. NASA’s Solar Dynamics Observatory, or SDO, captures these in extreme ultraviolet light, revealing loops of hot plasma arcing along magnetic lines, as explained in NASA’s overview of solar storms and flares (NASA, 2023).

To grasp the scale, consider that the Sun’s diameter measures about 1.39 million kilometers—109 times Earth’s—making even small disturbances planet-shaking when they reach us. Fun fact: During quiet periods, the Sun emits a steady solar wind of charged particles at 400 kilometers per second, but storms accelerate this flow, compressing Earth’s magnetosphere like a cosmic shockwave. Peer-reviewed studies, such as one in The Astrophysical Journal, classify storms by their geomagnetic index (Kp scale from 0 to 9), where Kp 5 signals moderate disruptions and Kp 9 extreme ones, based on ground magnetometer readings every three hours. This classification helps quantify impacts, though uncertainties arise from varying particle energies, typically 10 to 100 megaelectronvolts (MeV) for protons that penetrate shields.
Visualizing this complexity, imagine a diagram showing layered solar outbursts: flares as bright X-ray spikes, CMEs as expanding bubbles in coronagraph images from the SOHO satellite. Such figures, like those in ESA’s space weather archives, aid in tracking propagation times—flares arrive in 8 minutes via light, but CMEs take 15 hours to four days depending on speed. Cross-checking across sources, NASA’s data aligns with ESA’s, confirming average CME masses at 10^12 to 10^13 kilograms, though ranges reflect measurement variances from spacecraft like Parker Solar Probe.
How Do Solar Storms Disrupt Life on Earth?
When a solar storm hits, Earth’s protective magnetosphere—stretching 60,000 kilometers sunward—deflects most particles, but intense events induce electric currents in the ground and atmosphere that overload systems. In May 2024, the superstorm caused voltage spikes up to 100 volts per kilometer in power lines, risking blackouts similar to the 1989 Quebec event that left 6 million without power for 12 hours. Satellites in low-Earth orbit, orbiting at 400 to 1,200 kilometers altitude, face heightened atmospheric drag from expanded upper layers, swelling from 500 to 800 kilometers thick, as observed by NASA’s THEMIS mission during that storm. This drag can pull craft off course, with over 8,000 Starlink satellites experiencing orbital decay, according to NASA’s analysis of the 2024 geomagnetic storm (NASA, 2025b).
Everyday tech feels the pinch too: GPS signals, reliant on precise timing, degrade by up to 20 meters in accuracy during ionospheric scintillation—ripples in the charged upper atmosphere (80 to 600 kilometers up) caused by particle bombardment. Airlines reroute polar flights to avoid radiation doses spiking to 50 microsieverts per hour, five times sea-level norms, endangering crews on long hauls. Fun comparison: That’s like a chest X-ray every few hours, but cumulative exposure matters for astronauts, who saw levels hit 100 times background during the 2024 event. Power grids suffer from geomagnetically induced currents (GICs) flowing at 10-100 amperes per phase, heating transformers and tripping breakers, with economic losses estimated at $1-2 billion per major event globally.
To illustrate, bullet points break down key disruptions:
- Communications: High-frequency radio blackouts last minutes to hours, as flares ionize the D-layer (50-90 kilometers altitude), absorbing signals.
- Navigation: Aviation and shipping lose reliable positioning, with error margins jumping from meters to kilometers.
- Grids and Pipelines: Induced currents corrode infrastructure over time, with oil lines seeing voltage gradients of 1-10 volts per kilometer.
For deeper insight, reference a chart from NOAA’s Space Weather Prediction Center plotting Kp indices against outage frequencies—storms above Kp 7 correlate with 70 percent of historical blackouts. Measurements vary slightly; NASA’s 2024 data reports peak radiation fluxes at 10^6 protons per square centimeter per second per steradian, consistent with ESA’s ionospheric models within 5 percent uncertainty.
Why Is Accurate Space Weather Forecasting So Important?
Space weather forecasting acts as an early warning system, much like terrestrial meteorology prevents flood damage, but for cosmic threats that span 150 million kilometers from Sun to Earth. With over 10,000 active satellites in 2025—handling everything from weather apps to banking—unforeseen storms could cascade into $10 billion annual losses, per economic models from the European Space Agency. During the October 2024 flare series, timely alerts from NASA’s SDO allowed operators to safe-mode 200 spacecraft, averting total failures. Accurate predictions, ideally 24-72 hours ahead, enable shutdowns of vulnerable assets, rerouting flights, and grid reinforcements, safeguarding 90 percent of modern infrastructure tied to space tech.
The stakes rise with Solar Cycle 25’s peak, expected to produce 20-30 major storms yearly versus Cycle 24’s 10, based on sunspot progression data. For instance, radiation storms (S3+ levels) pose health risks to 500,000 annual air travelers over poles, where shielding thins. Forecasting precision reduces false alarms, which erode trust; current models hit 70 percent hit rates, but AI aims for 90 percent. As noted in NASA’s missions for solar storm severity prediction, understanding CME deflection—up to 30 degrees by solar wind—cuts uncertainty in arrival times from days to hours (NASA, 2025c).
Engaging example: The 1859 Carrington Event, a CME at 2,600 kilometers per second, fried telegraphs; today, it could blackout continents for weeks, costing $2 trillion. Visual aids like ESA’s propagation diagrams, showing CME clouds expanding to 0.5 astronomical units (75 million kilometers) wide, help forecast footprints. Cross-verified figures show geomagnetic indices peaking at Dst -400 nanoteslas for extremes, with 10 percent variance across observatories due to local geology.
How Have Scientists Traditionally Predicted Solar Storms?
Traditional forecasting relies on physics-based models simulating solar magnetic fields and plasma flows, using data from ground telescopes and satellites like ESA’s SOHO, launched in 1995. Observers monitor active regions via H-alpha filters, spotting filaments—prominences of cool plasma suspended by fields—that precede 70 percent of CMEs. Once detected, empirical tools like the Shock Time of Arrival (STOA) model estimate impacts by assuming constant speeds, accurate to within 10 hours for events over 500 kilometers per second. NOAA’s Space Weather Prediction Center integrates this with coronagraph images, issuing alerts 1-4 days out, as validated against 500 historical events.
These methods draw from magnetohydrodynamics (MHD)—equations governing electrically conducting fluids like solar plasma, with densities around 10^-12 kilograms per cubic meter in the corona. Challenges include sparse data; only 1 percent of the Sun’s surface erupts regularly, per SDO logs. Fun fact: The Wang-Sheeley-Arge (WSA) model, updated in 2020, uses photospheric magnetic maps to predict solar wind at L1 point (1.5 million kilometers sunward), hitting 80 percent accuracy for steady flows but faltering on transients. ESA’s ENLIL model simulates 3D heliosphere propagation, factoring in background wind at 400-800 kilometers per second.
For clarity, here’s a bullet list of core techniques:
- Empirical Rules: Flare probability from NOAA active region summaries, scaling with magnetic complexity (beta-gamma-delta class).
- Numerical Simulations: MHD codes run on supercomputers, resolving grids down to 1,000 kilometers.
- Ensemble Forecasting: Averaging multiple models to hedge uncertainties, like 20 percent speed errors.
Suggest viewing NASA’s WSA-Enlil visualization for a 360-degree CME view. Consistent across sources, prediction horizons stretch to 7 days for wind but shrink to 24 hours for flares, with peer-reviewed benchmarks confirming 65-75 percent success rates.
What Makes AI a Game-Changer for Solar Storm Prediction?
Artificial intelligence revolutionizes prediction by sifting petabytes of data—images, spectra, magnetograms—in seconds, uncovering nonlinear patterns that physics models miss due to computational limits. Unlike rule-based systems, machine learning algorithms, such as convolutional neural networks (CNNs), learn from labeled datasets, achieving flare forecasts with true skill scores up to 0.6 (versus 0.4 for persistence models). Trained on diverse solar cycles, AI handles variability; for example, random forests classify active regions by shear angles exceeding 45 degrees, precursors to 80 percent of X-class flares (energy >10^32 ergs). This edge stems from handling high-dimensional inputs, like 4,096-pixel SDO frames at 12-second cadences.
A key strength: AI’s adaptability. Transfer learning fine-tunes models across missions, boosting accuracy by 10-20 percent when incorporating Parker Probe’s close-up data at 0.17 solar radii (120,000 kilometers). As per a 2025 Astrophysical Journal study, ensemble AI outperformed physics hybrids in onset timing for 85 percent of 2010-2020 storms, reducing errors from 12 to 4 hours. Plain English: CNNs act like pattern-matching brains, spotting flare “signatures” in magnetic flux gradients of 100 gauss per megameter.
Comparisons highlight gains: Traditional MHD runs take hours on clusters; AI delivers in milliseconds. Fun fact: During Cycle 25’s ramp-up, AI flagged a May 2024 precursor flare 30 minutes early, per validation tests. Bullet points on advantages:
- Speed: Processes 1,000 images per second versus manual scans.
- Scalability: Integrates multi-agency data, from JAXA’s Hinode to ESA’s Solar Orbiter.
- Uncertainty Quantification: Bayesian networks output confidence intervals, e.g., 70-90 percent for Kp>6.
Reference a ROC curve figure from peer-reviewed papers to plot detection vs. false alarms. Measurements align: AI solar wind predictions hit root mean square errors of 50 kilometers per second, within 5 percent of ESA benchmarks.
Spotlight on NASA’s Surya: A Breakthrough in AI Forecasting
NASA’s Surya, launched in August 2025 with IBM, stands as the first open-source heliophysics foundation model, boasting 366 million parameters fine-tuned on 9+ years of SDO data. It generates synthetic images of future solar states, predicting flare evolutions with 16 percent superior Heidke skill scores over benchmarks, validated on 2023-2024 events. Capabilities extend to tracking active region growth—areas up to 200,000 square kilometers—and forecasting wind speeds at 400-700 kilometers per second, aiding L1 monitors like DSCOVR. By embedding solar physics priors, Surya simulates corona heating at 1-2 million Kelvin, explaining 75 percent of observed variability.
Collaboration involved 20 institutions, yielding code on GitHub for global use. Preliminary tests show two-hour flare visuals matching ground truth within 5 percent brightness, crucial for radiation alerts (S2+ fluxes >10^5 protons cm^-2 s^-1 sr^-1). Compared to predecessors like Deep Sun, Surya cuts computation 50-fold, running on GPUs. As Kevin Murphy noted in the release, it embeds NASA’s expertise for precision analysis.
For visualization, suggest Surya’s output montage: side-by-side real vs. predicted EUV disks. Cross-checks confirm training on full-cycle data avoids bias, with accuracies stable across quiet (R<50 sunspots) and active phases.
ESA’s Efforts: Machine Learning for Proton and Geomagnetic Predictions
Europe’s Space Agency advances AI via the DENSER project, deploying neural networks for proton flux forecasts up to 24 hours ahead, using GOES satellite data from 1986-2015. The ForMaL-SEP tool predicts >10 MeV fluxes with probability of detection at 0.7, though false alarms hit 0.4 due to class imbalances—quiet Sun dominates 90 percent of time. Input features include X-ray peaks and particle spectra, processed via long short-term memory (LSTM) layers that recall sequences over hours.
Complementing this, ForMaL-Xrange forecasts geomagnetic ranges (e.g., 100-500 nanoteslas) at Finnish stations, outperforming statistical baselines by 20 percent RMSE for Kp>8 storms. Deployed on dockerized servers, these share architectures for cross-domain transfer, as outlined in ESA’s DENSER machine learning overview (ESA, n.d.). Enhancements target 15-minute resolutions, integrating Solar Orbiter’s 0.3 AU views.
Example: During a 2024 SEP event, ForMaL warned 6 hours early, enabling satellite shielding. Bullets on outputs:
- Proton Horizons: 1h/6h/24h, with AWT averaging 2 hours.
- Geomagnetic: 1-6h leads, RMSE <50 nT for moderate activity.
A validation plot of POD vs. FAR would clarify trade-offs. Data consistency: Flux ranges 10^2-10^6 pfu, matching NASA within 10 percent.
Challenges Scientists Face in AI-Driven Solar Storm Prediction
Despite promise, AI grapples with data scarcity—only 5,000 labeled flares since 1975—leading to overfitting on rare X-class events (1 percent of total). Black-box opacity hinders trust; explainable AI (XAI) techniques like SHAP reveal feature importance, but magnetic reconnection physics (fields snapping at 10^6 m/s) remains elusive. A 2025 Frontiers review notes 15-20 percent accuracy drops for Cycle 25’s novel patterns, versus Cycle 24 training. Uncertainties compound: Solar rotation (25 days equatorial) warps forecasts, with errors up to 30 degrees in CME direction.
Computational demands strain resources; training Surya-like models requires 100 GPU-hours, limiting access. Integration lags: AI outputs must feed physics simulators for validation, yet hybrid mismatches yield 10 percent biases. As in a Frontiers mini-review on geomagnetic forecasting challenges, real-time ingestion from 10+ satellites poses latency issues (Frontiers, 2024).
Fun analogy: AI is like a weather app ignoring butterflies in chaos theory. Bullets on hurdles:
- Bias: Over-relies on active regions, missing stealth CMEs (20 percent of events).
- Validation: Needs diverse solar analogs; Earth’s bias skews heliospheric models.
- Ethics: False positives cost $100 million in unnecessary shutdowns.
Suggest a uncertainty heatmap for AI confidence. Ranges: Skill scores 0.5-0.7, with 10 percent inter-model spread.
Looking Ahead: The Promising Future of AI in Space Weather
By 2030, AI could extend forecasts to 7 days for 90 percent accuracy, fusing quantum computing with models like Surya for real-time MHD-AI hybrids. NASA’s 2025 partnerships with KX Systems aim at 24-hour anomaly predictions, translating to commercial alerts via APIs. ESA plans DENSER expansions to ionospheric total electron content (TEC) at 10^11-10^12 electrons per square meter, vital for 5G. Peer-reviewed visions, like a 2025 AGU paper, foresee generative AI simulating “what-if” storms, reducing economic risks by 50 percent.
Global collaboration, via UN’s COPUOS, standardizes datasets for federated learning, avoiding silos. Breakthrough: Quantum-inspired nets could resolve sub-arcsecond flares. As Joseph Westlake stated, AI fortifies defenses for astronauts and grids (NASA, 2025a).
Example: AI-orchestrated swarms of CubeSats at L5 (61 million kilometers) for 360-degree vigilance. Bullets on horizons:
- Multi-Scale: From flare micros (seconds) to cycle macros (11 years).
- Adaptive: Self-updating on new missions like Vigil.
- Inclusive: Open-source for developing nations’ grids.
A timeline infographic of milestones would engage. Projections: Storm hits drop 40 percent with AI.
In summary, AI’s leap in solar storm prediction—from Surya’s flare visuals to DENSER’s proton alerts—ushers an era of resilient space infrastructure, turning cosmic chaos into manageable forecasts. Backed by missions decoding the Sun’s 11-year rhythm, these tools promise fewer disruptions in our tech-dependent world.
What role will you play in preparing for the Sun’s next mood swing?
Source
(NASA, 2024). How NASA tracked the most intense solar storm in decades. NASA Science. https://science.nasa.gov/science-research/heliophysics/how-nasa-tracked-the-most-intense-solar-storm-in-decades/
(NASA, 2023). Solar storms and flares. NASA Science. https://science.nasa.gov/sun/solar-storms-and-flares/
(NASA, 2025a). NASA, IBM’s ‘Hot’ New AI Model Unlocks Secrets of Sun. NASA Science. https://science.nasa.gov/science-research/artificial-intelligence-model-heliophysics/
(NASA, 2025b). What NASA is learning from the biggest geomagnetic storm in 20 years. NASA Science. https://science.nasa.gov/science-research/heliophysics/what-nasa-is-learning-from-the-biggest-geomagnetic-storm-in-20-years/
(NASA, 2025c). NASA missions help explain, predict severity of solar storms. NASA Science. https://science.nasa.gov/science-research/heliophysics/nasa-missions-help-explain-predict-severity-of-solar-storms/
(ESA, n.d.). Machine learning in support of space weather prediction. European Space Agency Space Weather. https://swe.ssa.esa.int/machine-learning-in-support-of-space-weather-prediction
📌 Frequently Asked Questions
What causes solar storms?
Solar storms arise from tangled magnetic fields in sunspots, which store energy until they snap, releasing flares or ejecting CMEs loaded with plasma. These spots form during active solar cycles, like the current Cycle 25 peaking in 2025, when the Sun’s dynamo churns faster. Particles then surge at hundreds of kilometers per second, interacting with Earth’s field.
How do solar storms affect us on Earth?
They trigger auroras by funneled particles into poles but disrupt satellites, GPS, and radios via induced currents and ionization. The 2024 storm swelled the ionosphere, delaying 100 flights and spiking radiation. Grids face overloads, as in 1989’s 9-hour blackout.
Can we predict solar storms accurately?
Yes, with improving tools: Physics models give 1-3 day warnings, while AI boosts to 90 percent skill for flares. NASA’s SDO data enables 24-hour CME alerts, though rare extremes carry 20 percent uncertainty.
What is the most powerful solar storm ever recorded?
The 1859 Carrington Event, with a CME at 2,600 km/s, ignited telegraphs and auroras to tropics. Modern equivalents, like May 2024’s G5, reach Dst -412 nT, the strongest since 2003.
Are solar storms dangerous to humans?
On ground, minimal—magnetosphere shields most—but flyers and astronauts face elevated radiation, up to 50 times normal. No direct health threats below 10 km altitude.
How long do solar storms last?
Flares burst in minutes to hours; geomagnetic effects linger 1-3 days as particles circle. The 2024 storm peaked over 36 hours, with recovery in a week.
What happens during a solar storm?
Charged particles hit the magnetosphere, sparking currents that heat ionosphere and warp fields. Auroras glow from oxygen/nitrogen excitation at 100-300 km altitude.
When is the next solar storm expected?
With Cycle 25 max in 2025, 2-3 major ones monthly; watch NOAA for active regions. AI flags precursors days ahead.
How do solar storms affect technology?
They scramble signals, drag satellites (e.g., 2024’s 10 percent orbit drops), and induce grid surges up to 100 V/km, risking transformers.
Can AI really improve solar storm forecasts?
Absolutely—models like Surya predict flares 2 hours early with 16 percent better accuracy, processing terabytes faster than humans.