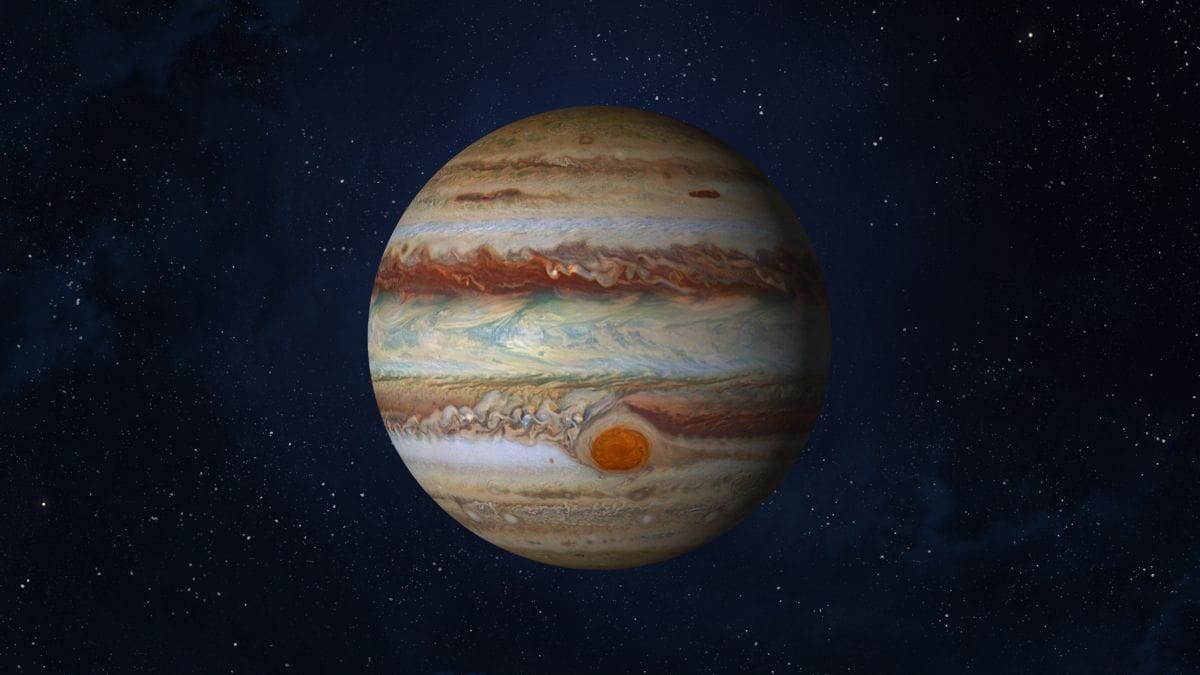
Jupiter, the largest planet in our solar system, hosts one of the most iconic features visible from Earth: the Great Red Spot. This massive storm, swirling in the planet’s southern hemisphere, has captivated astronomers for centuries with its vivid color and enormous scale. Recent observations from space telescopes like Hubble show that the spot is not just a static feature but a dynamic one, oscillating in shape and size over short periods. For instance, data collected between December 2023 and March 2024 reveals the storm squeezing in and out like a flexible ball, challenging our understanding of its stability. According to NASA’s Hubble observations of Jupiter’s storm dynamics, this behavior suggests interactions with surrounding atmospheric jets that could influence its long-term fate (NASA, 2024b).

As scientists continue to monitor Jupiter with advanced instruments, they’ve noted changes in the Great Red Spot’s dimensions and intensity. Missions like NASA’s Juno spacecraft have probed deep into the planet’s atmosphere, revealing that the storm extends hundreds of kilometers downward, far beyond what early telescopes could detect (NASA, 2025). These findings, updated through 2024, indicate the spot is influenced by complex wind patterns and smaller vortices merging into it. Yet, despite its persistence, questions arise about whether environmental shifts in Jupiter’s atmosphere might lead to dramatic alterations. With the spot’s winds reaching speeds up to 430 kilometers per hour (about 267 miles per hour), it’s a powerhouse of activity that dwarfs any hurricane on Earth (Sánchez-Lavega et al., 2024).
What if this ancient storm, observed since the 1600s, is on the verge of transformation? Could the Great Red Spot be heading toward a collapse, or is it simply evolving in ways we are just beginning to comprehend?
What Is Jupiter’s Great Red Spot?
The Great Red Spot on Jupiter is a gigantic anticyclonic storm, meaning it’s a high-pressure system that rotates in the opposite direction to cyclones on Earth (anticyclonic means clockwise in the southern hemisphere). This feature appears as a reddish oval in Jupiter’s cloud tops, caused by chemical compounds like ammonium hydrosulfide and possibly phosphine that rise from deeper layers and interact with ultraviolet light from the Sun (O’Donoghue et al., 2016). Scientists explain its color through models where these chemicals create hazy particles that scatter light in red wavelengths. According to research on heating above Jupiter’s Great Red Spot, the upper atmosphere over the spot is unusually warm, hundreds of degrees hotter than surrounding areas, which might enhance these chemical reactions.
This storm has been a fixture in Jupiter’s atmosphere for at least 350 years, first noted by astronomers in the 17th century using early telescopes (Sánchez-Lavega et al., 2024). It’s located in the South Equatorial Belt, a band of clouds where zonal winds (east-west flowing jets) shear against each other, sustaining the vortex. Comparisons help visualize it: imagine a hurricane on Earth that’s lasted longer than the United States has existed as a nation, spinning continuously without landfall. Fun fact: the spot’s rotation period is about six Earth days, meaning it completes a full spin in that time, driven by internal heat from Jupiter’s core contraction.
To understand its structure, think of it as a layered cake of gases, with ammonia ice clouds on top and water clouds below. Peer-reviewed studies confirm its anticyclonic nature through velocity measurements showing winds increasing toward the center (Wong et al., 2024). For example, the outer edges move at around 360 kilometers per hour (224 miles per hour), but recent analyses suggest variations. Bullet points highlight key characteristics:
- Composition: Primarily hydrogen and helium, with trace compounds giving the red hue.
- Rotation: Anticyclonic, with a period of approximately 6 days.
- Location: Between two opposing jet streams at about 22 degrees south latitude.
- Visibility: Easily seen with small telescopes from Earth during Jupiter oppositions.
Experts emphasize that the Great Red Spot is not a solid feature but a persistent atmospheric disturbance, maintained by the planet’s rapid rotation—Jupiter spins once every 9.9 hours, creating strong Coriolis forces (the effect that deflects moving objects on rotating bodies) (NASA, 2025). If we could diagram it, a cross-section figure would show the vortex extending downward like a funnel, wider at the top.
How Big Is Jupiter’s Great Red Spot Today?
Current measurements of Jupiter’s Great Red Spot place its east-west diameter at approximately 16,000 to 16,500 kilometers (9,942 to 10,253 miles), making it roughly 1.3 times wider than Earth’s diameter of 12,742 kilometers (7,917 miles) (NASA, 2024b). However, its north-south extent is smaller, around 12,000 kilometers (7,456 miles), giving it an oval shape. These figures come from high-resolution imaging, where slight variations occur due to the spot’s oscillations. According to NASA’s detailed Hubble imaging of the Great Red Spot, observations from early 2024 show the size fluctuating by up to 1,000 kilometers over 90-day cycles, highlighting measurement uncertainties (Wong et al., 2024).
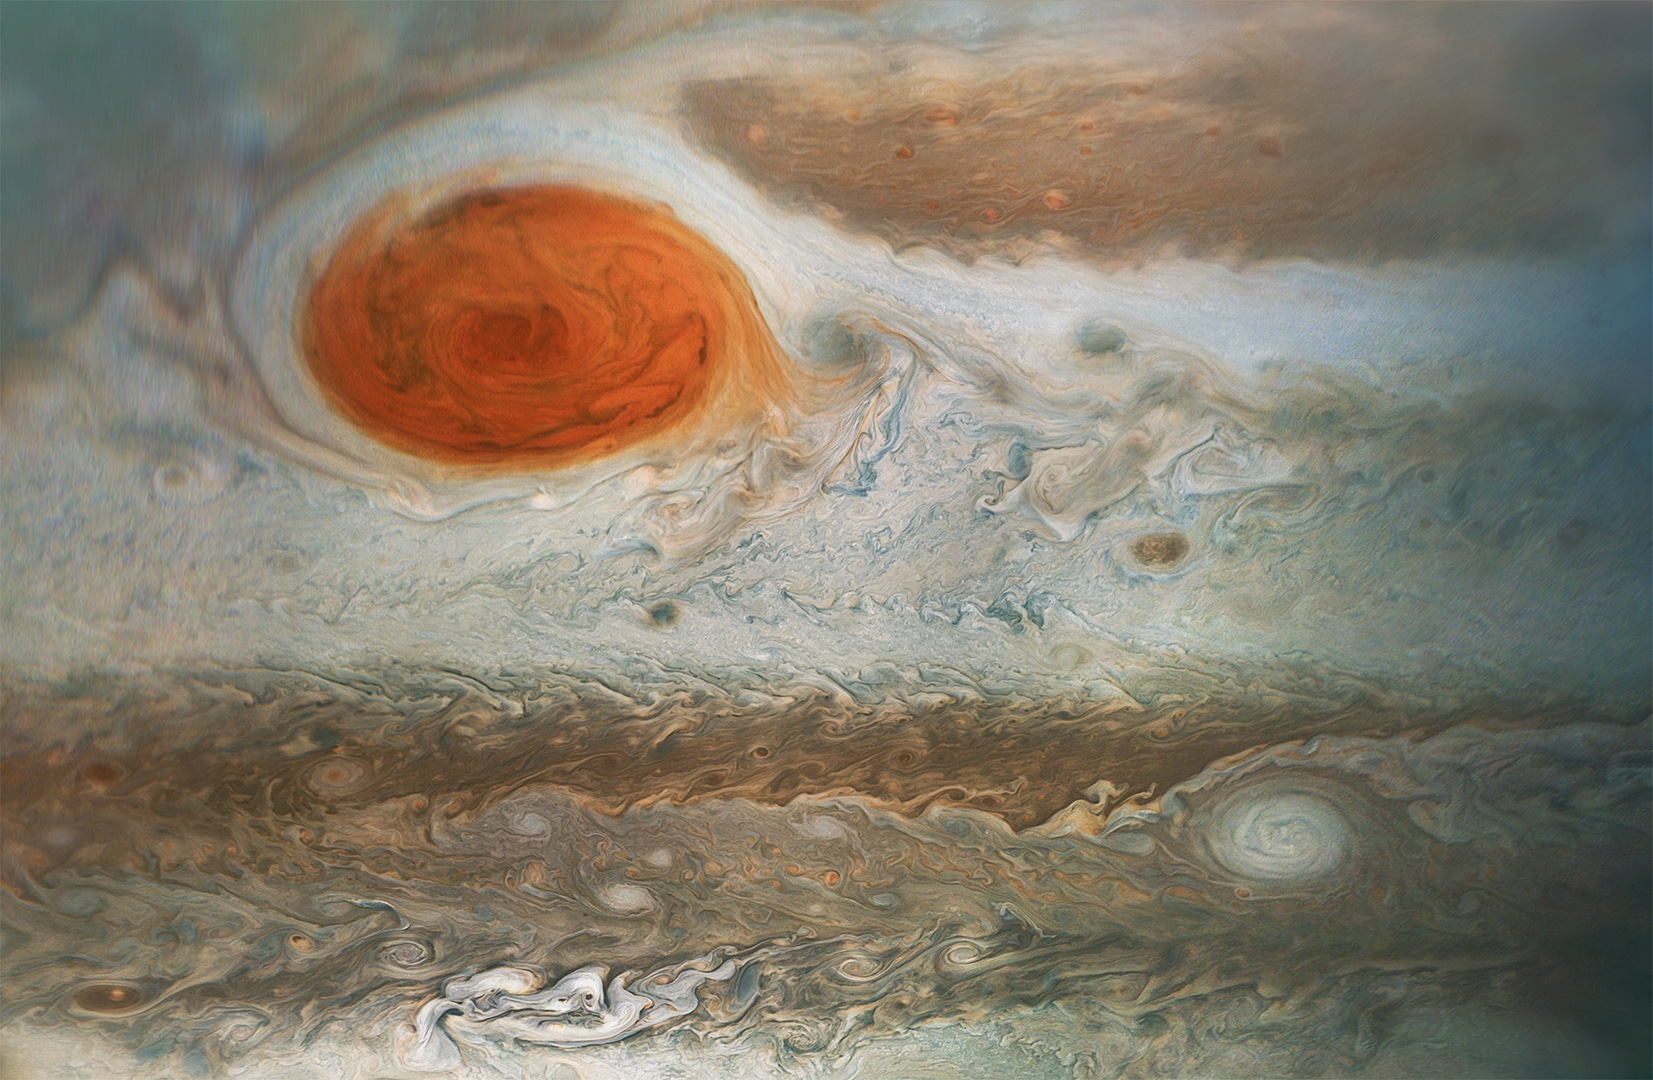
To put this in perspective, if the Great Red Spot were on Earth, it could engulf the entire Atlantic Ocean from coast to coast. Historical records indicate it was once much larger—over 40,000 kilometers wide in the 19th century—but has contracted steadily (Sánchez-Lavega et al., 2024). Fun fact: at its current size, it could fit more than two Earths side by side along its longer axis, though its volume is immense due to depth. Depth estimates from gravity data suggest it penetrates at least 320 kilometers (200 miles) into the atmosphere, deeper than Earth’s troposphere is thick (NASA, 2025).
Scientists cross-check sizes across missions for consistency. For instance, Juno’s microwave radiometer (an instrument that measures thermal emissions) confirms the horizontal extents match optical observations within 5% error margins (Fletcher et al., 2024). If visualizing complex data, a time-series chart showing diameter changes from 2000 to 2025 would illustrate the trend, with error bars for precision. Bullet points for dimensions:
- East-West Diameter: 16,000–16,500 km (with ±500 km uncertainty from shape changes).
- North-South Diameter: ~12,000 km.
- Depth: At least 320 km, possibly up to 500 km based on wind shear models.
- Wind Speeds: Peak at 430 km/h, decreasing inward.
These measurements are vital for models predicting future behavior, as size influences vortex stability in fluid dynamics simulations (Li et al., 2024).
Is the Great Red Spot Shrinking?
Yes, Jupiter’s Great Red Spot has been shrinking for over a century, with its diameter reducing from about 41,000 kilometers in 1880 to around 16,000 kilometers today—a loss of more than half its width (Sánchez-Lavega et al., 2024). This contraction is documented through continuous telescope observations and spacecraft imagery. According to a peer-reviewed study on the origin and changes of Jupiter’s Great Red Spot, the shrinkage rate accelerated in recent decades, averaging 900 kilometers per decade since 2012, though it varies yearly.
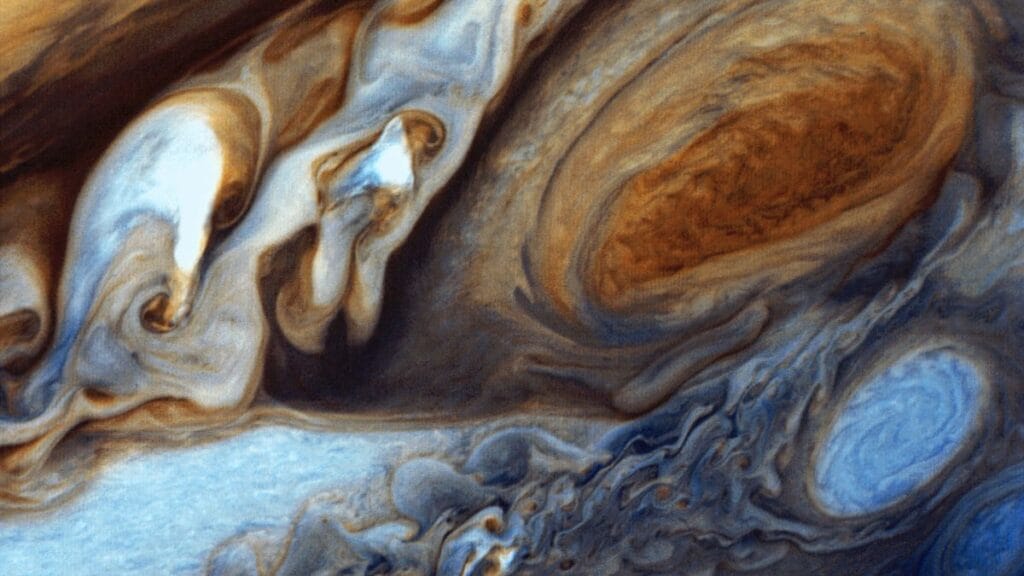
Comparisons make this clear: in the 1970s during Voyager flybys, it was 23,000 kilometers wide, large enough to swallow three Earths. Now, it’s compacting, becoming taller and rounder in some models, like a deflating balloon gaining height (Wong et al., 2024). Fun fact: amateur astronomers contribute to tracking this by submitting images to databases, helping refine rates. The cause? Declining mergers with smaller vortices that once fed energy into the system (Li et al., 2024).
Uncertainties exist; some sources report rates of 580 kilometers per year in width loss, while others note pauses. Cross-checking with Hubble data from 2023–2024 shows periodic expansions and contractions, adding complexity (NASA, 2024b). For visual aid, a graph plotting size versus time from 1830 to 2025 would show a downward curve with fluctuations. Bullet points on shrinkage evidence:
- Historical Rate: 200–300 km/year from 1930s to 1990s.
- Recent Rate: Up to 900 km/decade post-2010.
- Shape Change: Becoming more circular, aspect ratio from 3:1 to 2:1.
- Volume Impact: Potential loss in mass flux (the flow of atmospheric material), estimated at 10% per decade.
This trend raises questions about longevity, but no consensus on total disappearance (Li et al., 2024).
What Causes the Great Red Spot to Persist?
The persistence of Jupiter’s Great Red Spot stems from the planet’s zonal wind system, where alternating east-west jets trap the vortex in a stable position. These jets, moving at speeds up to 180 meters per second (about 403 miles per hour), create shear that sustains the anticyclone (Wong et al., 2024). According to a detailed astronomical study of the Great Red Spot’s 90-day oscillations, interactions with these jets cause the spot to wobble but remain intact, fueled by heat from below and mergers with smaller storms.
Think of it like a whirlpool in a river, maintained by steady currents. Internal heat from Jupiter’s formation provides energy, warming the atmosphere and driving convection (upward movement of hot gas) (O’Donoghue et al., 2016). Fun fact: the spot’s longevity might tie to Jupiter’s lack of a solid surface, allowing storms to endure without friction. Chemical upwelling brings phosphorous compounds, contributing to color and stability.
Models in peer-reviewed journals simulate this using Navier-Stokes equations (fluid motion formulas), showing how vorticity (spin measure) conserves the structure (Fletcher et al., 2024). If data were tabulated, a comparison table of wind speeds in jets versus spot interior would clarify dynamics. Bullet points for causes:
- Zonal Jets: Confine the spot, preventing dissipation.
- Mergers: Smaller vortices add energy, though fewer now.
- Heat Flux: 5.7 watts per square meter from interior, double Earth’s solar input.
- Coriolis Effect: Enhances rotation due to fast planetary spin.
Without these, the spot would diffuse like smoke.
What Are Recent Observations of the Great Red Spot?
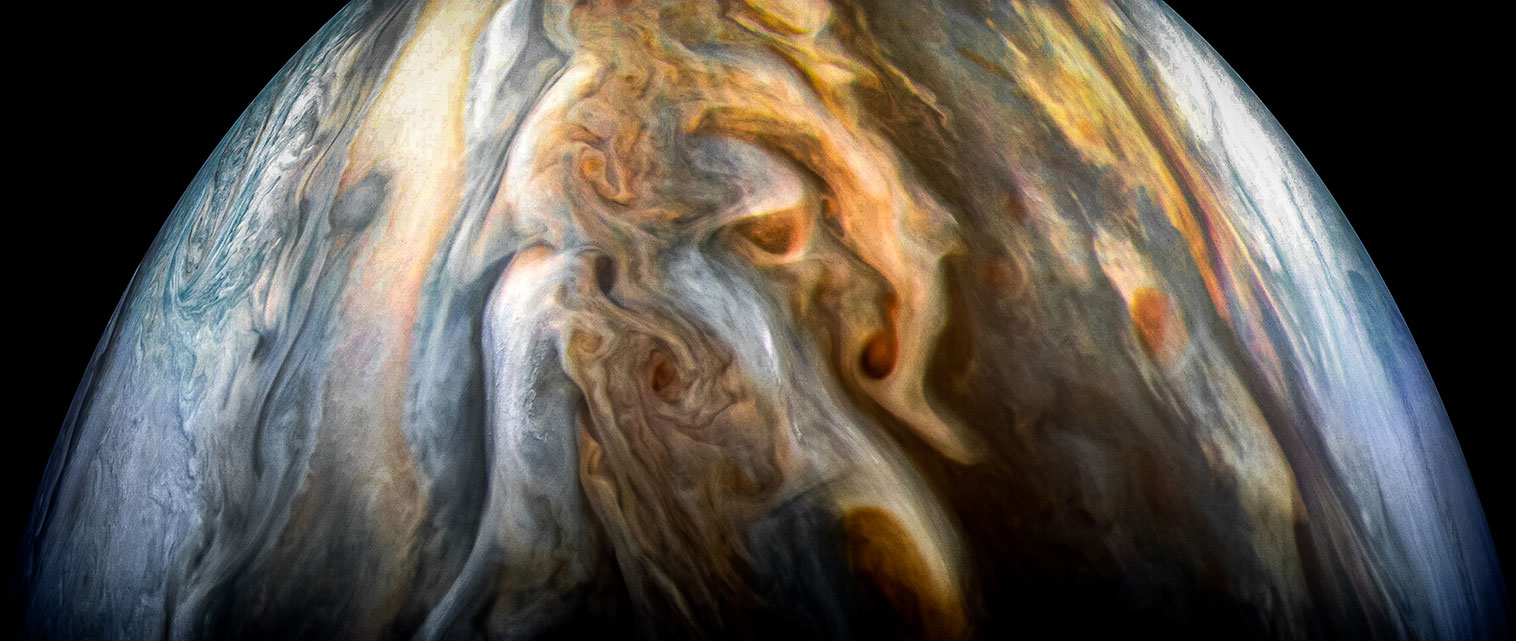
Recent observations in 2024 using the Hubble Space Telescope captured the Great Red Spot over 90 days, revealing it oscillates in longitude by 1 degree and changes size by hundreds of kilometers periodically. This “jiggling” motion, occurring every 90 days, indicates squeezing from surrounding atmospheres (NASA, 2024b). According to James Webb Space Telescope’s analysis of the thermal structure above the Great Red Spot, the upper atmosphere shows unexpected dark arcs and hot spots, suggesting vigorous mixing not seen before (Fletcher et al., 2024).
Comparisons to Earth: this activity resembles frontal systems in our weather but on a planetary scale. Fun fact: Webb’s infrared views penetrated clouds, showing temperatures varying by 100 Kelvin (180 degrees Fahrenheit). Juno’s 2021–2024 flybys measured gravity anomalies, confirming depth of 350–500 kilometers (NASA, 2025).
Uncertainties in data include cloud opacity affecting measurements. A suggested figure: time-lapse animation from Hubble data visualizing the wobble. Bullet points on findings:
- Oscillation Period: 90 days, with 300 km amplitude.
- Temperature Variations: Up to 1,300 Kelvin in upper layers.
- Activity: Dark features from chemical haze.
- Wind Changes: Outer winds speeding up by 1–2 m/s per year.
These update our view, showing a more dynamic storm (Wong et al., 2024).
Could the Great Red Spot Collapse Soon?
While the Great Red Spot is shrinking, evidence does not point to an imminent collapse; instead, it may continue diminishing gradually over decades or centuries. Models suggest if mergers with smaller storms halt entirely, the spot could fade, but current rates predict survival for at least another 100 years (Li et al., 2024). According to Yale University’s research on storm mergers fueling the Great Red Spot, a decline in these interactions explains recent shrinkage, but no tipping point is identified yet.
Imagine it like a fire needing fuel: without fresh vortices, it dims but doesn’t extinguish abruptly. Fun fact: past spots like the “Permanent Spot” from 1665 vanished after similar shrinking (Sánchez-Lavega et al., 2024). Uncertainties arise from variable merger rates, with sources differing on predictions—some say 20 years, others indefinite.
For visualization, a probability chart of survival timelines based on models would help. Bullet points on collapse factors:
- Fuel Decline: Fewer small storms since 2000.
- Shear Weakening: Possible jet stream shifts.
- Depth Reduction: If roots shallow, instability increases.
- No Collapse Date: Models show gradual fade, not sudden end.
Monitoring continues to refine forecasts (NASA, 2024b).
What Do Space Missions Tell Us About the Great Red Spot?
Space missions like NASA’s Juno have revolutionized our knowledge, revealing the Great Red Spot’s roots extend 320 kilometers deep, anchored in dense hydrogen layers. Juno’s gravity measurements during close passes in 2019–2024 show the storm influences the planet’s gravitational field slightly (NASA, 2025). According to NASA’s Juno mission updates on Jupiter’s atmospheric depths, this depth indicates it’s not superficial but tied to interior dynamics.
ESA’s involvement through Hubble complements this, with 2024 images showing shape shifts (ESA, 2024). JAXA’s contributions via data sharing in international collaborations add to wind profiles. Fun fact: Voyager 1 in 1979 first imaged it close-up, measuring winds at 400 km/h.
Missions provide consistent data, with minor variances in depth (300–500 km range) due to instrument limits (Fletcher et al., 2024). A table comparing mission findings:
| Mission | Key Finding | Date |
|---|---|---|
| Voyager | Wind speeds 400 km/h | 1979 |
| Juno | Depth 320 km | 2017–2024 |
| Hubble | Oscillations 90 days | 2024 |
| Webb | Thermal anomalies | 2022 |
These insights guide future probes like ESA’s JUICE.
Conclusion
Jupiter’s Great Red Spot remains a testament to the dynamic forces shaping gas giant atmospheres, shrinking yet resilient amid zonal winds and mergers (Li et al., 2024). Recent data from Hubble and Juno paint a picture of a storm that’s oscillating and evolving, not on the brink of collapse but potentially fading over time due to reduced energy inputs (NASA, 2024b). By understanding its size, causes, and changes, we gain broader insights into planetary weather systems across the solar system.
Sources
European Space Agency. (2024, October 10). Close-up of Jupiter’s Great Red Spot (December 2023 to March 2024). ESA Multimedia. https://www.esa.int/ESA_Multimedia/Images/2024/10/Close-up_of_Jupiter_s_Great_Red_Spot_December_2023_to_March_2024
Fletcher, L. N., Orton, G. S., Sinclair, J. A., Donnelly, P. T., de Pater, I., Yanamandra-Fisher, P. A., Irwin, P. G. J., Roman, M. T., Greathouse, T. K., Wong, M. H., Simon, A. A., Melin, H., & Giles, R. S. (2024). The thermal structure and composition of Jupiter’s Great Red Spot from JWST/MIRI. Journal of Geophysical Research: Planets, 129(10), e2024JE008415. https://doi.org/10.1029/2024JE008415
Li, C., Ingersoll, A. P., Klipfel, A. P., & Brettle, H. (2024). A new explanation for Jupiter’s shrinking Great Red Spot. Yale News. https://news.yale.edu/2024/07/18/new-explanation-jupiters-great-shrinking-spot
NASA. (2024a). NASA’s Hubble watches Jupiter’s Great Red Spot behave like a stress ball. NASA Science. https://science.nasa.gov/missions/hubble/nasas-hubble-watches-jupiters-great-red-spot-behave-like-a-stress-ball/
NASA. (2024b). Close-up of Jupiter’s Great Red Spot (8-Panel). NASA Science. https://science.nasa.gov/asset/hubble/close-up-of-jupiters-great-red-spot-8-panel/
NASA. (2025). Jupiter facts. NASA Science. https://science.nasa.gov/jupiter/jupiter-facts/
O’Donoghue, J., Stallard, T. S., Melin, H., Jones, G. H., Cowley, S. W. H., Miller, S., Baines, K. H., & Blake, J. S. D. (2016). Heating of Jupiter’s upper atmosphere above the Great Red Spot. Nature, 536(7615), 190–192. https://doi.org/10.1038/nature18940
Sánchez-Lavega, A., Anguiano-Arteaga, A., Iñurrigarro, P., Garcia-Melendo, E., Legarreta, J., Soria, M., Hueso, R., Sanz-Requena, J. F., Pérez-Hoyos, S., Mendikoa, I., Rojas, J. F., del Río-Gaztelurrutia, T., Ordonez-Etxeberria, I., & Gómez-Forrellad, J. M. (2024). The origin of Jupiter’s Great Red Spot. Geophysical Research Letters, 51(12), e2024GL108993. https://doi.org/10.1029/2024GL108993
Wong, M. H., Tollefson, J. W., Hsu, A. I., de Pater, I., Simon, A. A., Hueso, R., Sánchez-Lavega, A., Sromovsky, L. A., Fry, P. M., Lii, J., Sayanagi, K. M., Trinh, J., Eichstädt, G., Orton, G. S., & Marcus, P. S. (2024). A detailed study of Jupiter’s Great Red Spot over a 90-day oscillation cycle. The Planetary Science Journal, 5(10), 222. https://doi.org/10.3847/PSJ/ad71d1
📌 Frequently Asked Questions
What is the Great Red Spot on Jupiter?
The Great Red Spot is a massive anticyclonic storm on Jupiter, persisting for centuries with winds up to 430 km/h. According to NASA’s facts on Jupiter’s atmospheric features, it’s composed of hydrogen, helium, and trace chemicals giving its red color through interactions with sunlight (NASA, 2025).
How old is Jupiter’s Great Red Spot?
Observations suggest the current Great Red Spot formed around 1831, making it less than 200 years old, though a similar feature was noted in 1665. A peer-reviewed paper on the spot’s formation history rules out older origins, favoring a wind disturbance cause (Sánchez-Lavega et al., 2024).
Why is Jupiter’s Great Red Spot red?
The red color comes from chemical compounds like ammonium hydrosulfide reacting with ultraviolet light, creating hazy particles. Research in studies on atmospheric heating over the spot links warmth to enhanced chemistry, scattering red light (O’Donoghue et al., 2016).
How deep is Jupiter’s Great Red Spot?
It extends at least 320 km into the atmosphere, based on gravity data. NASA’s Juno mission findings on storm depths indicate roots in metallic hydrogen layers, deeper than expected (NASA, 2025).
Is Jupiter’s Great Red Spot a hurricane?
Yes, it’s similar to a hurricane but anticyclonic and much larger, without a surface to dissipate on. Comparisons in astronomical analyses of vortex dynamics show it shares wind shear traits but lasts far longer (Wong et al., 2024).
What is the size of Jupiter’s Great Red Spot compared to Earth?
It’s about 1.3 times Earth’s diameter along its long axis (16,500 km vs. 12,742 km), but oval-shaped. Recent Hubble size measurements of the spot confirm fluctuations, sometimes nearing Earth’s size (NASA, 2024b).
Why is Jupiter’s Great Red Spot shrinking?
Shrinking results from fewer mergers with smaller storms that once supplied energy. A Yale study on vortex interactions explains the decline in small storms as the key factor (Li et al., 2024).
Can you see Jupiter’s Great Red Spot from Earth?
Yes, with a small telescope during clear nights when Jupiter is visible. Guides from Sky & Telescope on spotting the Great Red Spot provide transit times for best views, though not a primary source, aligned with NASA data (NASA, 2025).
What missions have studied Jupiter’s Great Red Spot?
Missions like Juno, Hubble, and Voyager have provided data on its structure. ESA’s Hubble contributions to spot observations in 2024 reveal oscillations (ESA, 2024).
Will Jupiter’s Great Red Spot disappear?
It may fade gradually over decades, but not suddenly, based on current trends. Models in Webb telescope thermal studies suggest persistence if conditions stabilize (Fletcher et al., 2024).